Data simply put is meaningful information that can help people reach a decision. Business data means all information relevant to different aspects of a business that are stored in the company database. These can be information about products and services, information about clients and generally the working dynamics of any business. All this data may be stored in the company’s data base as an independent entity or as part of relationships in tabular form. The data needs to be relevant and updated regularly to mirror the current status of the company’s performance in regards to its products and services.
Data is the lifeblood of any business and is no longer just recorded for housekeeping purposes. Rather, this data is now a valuable asset of the company that can be manipulated in different ways to give valuable insight into company’s performance and business outcomes. They can be used to setup product targets and manage inventory and logs to compare progress and keep track of any success or failure stories. Data can help track reasons for such stories and help eradicate the problems that might be hindering the progress of a product or service.
“Every company has big data in its future, and every company will eventually be in the data business.” – Thomas H. Davenport, American academic and author specializing in analytics, business process innovation, and knowledge management.
Importance of Data Analysis
As already established, data provides valuable insights that can help people improve their product marketing and setup the performance metrics and indicators to find out if their business is heading in the right direction and if not, what measures can be taken to change the performance of their products so that they can experience positive impact of data on their business. It is the job of data analysts in a company to analyse the existing business data and make predictions about the performance of their products. These predictions are used by management to set and meet future targets for the growth of their products.
With the recent emphasis on data analysis and data visualization, data is not restricted to numbers anymore. Data can be numbers, text as well as images, documents and media files as well. All these data become relevant in the context they are used and for the business they are catering to. These data after analysis can be used to better their products, reduce their manufacturing and maintenance expenses or find areas of improvement in their existing business model.
Data analysis is rapidly becoming the backbone of any business infrastructure. Analysts can gather data from the business database and can identify the market trends and performance of the business in comparison to its competitors. With each company and business adopting similar data analysis techniques and tools, it is growing into a big competition for businesses to stand out in their niche and maintain a firm stand. Ongoing data analysis can help businesses achieve this goal and maintain it with constant review of their data analytics and measures taken to improve their products and services based of the data analysis results and predictions.
“Information is the oil of the 21st century, and analytics is the combustion engine.” – Peter Sondergaard, senior vice president, Gartner Research.
Data analysis tools
Numerous Data analysis tools have surfaced in the market that help businesses with their data analytics and give them an edge in competing with others in the market. Using these tools, business can generate reports and other visualizations that would let the data analysts observe the business trends and monitor the performance metrics. They can then advice management and other decision making authority of the current status of their business. The management could have their own set of relevant reports for monitoring. This way the data analysis tool can provide valuable business intelligence for your business and help you better your products and services taking your business to greater heights.
Some benefits of these data analysis tools could be that you can increase performance of your existing products, you can search for newer products within your niche. You can also identify problems areas within your business and strategically deal with them by developing specific plans to target problem areas. Some other benefits could be cost optimization within your company. Increased productivity can be achieved by monitoring your resource usage in terms of hardware devices or human resource allocation. Data analysis tools can do wonders for business customer relationships. They can help businesses to identify gaps in customer relationship and use data from customers’ feedback to improve in this area. Increased sales and services and analytics to monitor and identify popularity of product in specific areas and then find out what is working for some areas and try to implement similar plans for other areas can help businesses achieve their targeted goals.
Features of Data analysis tools
Data reporting: Data reporting is the pivotal feature in a data analysis tool. There are a great number of data reporting tools that can help users design and generate customized, detailed reports in real time.
Easy result format: Many data analysis tools cater to different business needs and present their business data in easy result format understandable to the user. There are many report formats to choose from. The user can add and edit data columns to the generated report and manipulate data according to their needs.
Visual analysis: Data analysis tools nowadays are usually equipped with visual analysis options that let user generate beautiful and sophisticated visualization for their data. These visuals provide a deeper understanding of business data than pages and pages of lengthy reports and can contribute a much greater meaning than tabular reports.
Dashboards: Dashboards usually accumulate different data reports and visual representations on a single screen. This gives user the ability to monitor different performance indicators simultaneously. This is helpful when businesses are monitoring data that changes in real time and the change is critical in taking decisions that may impact business growth.
Security: Security is important feature in nay software but if business data is involved in the situation it becomes more critical. Data analysis tools should be optimized for data security and should follow all standard protocols to keep data safe and secure from unwanted intrusion or cybercriminal activity.
Examples of Data Analysis tools
Here is a list of data analysis and business intelligence tools to get you started. When making your choice you should keep in mind not only the most popular features of data analysis tools but also your own business requirements are needs. Different software tools may cater to different types of end users and this must be taken into consideration when making your investment in a data analysis and business intelligence tool.
IBM Data analytics
Helps users to mitigate risk and achieve operational efficiency. It helps user generate reports and visuals for analysis and generate relevant business trends.
- Make your data ready for an AI and hybrid multicloud world
- Make data simple and accessible
- Organize data to create a business-ready analytics foundation
- Build and run AI with trust and transparency
- Operationalize AI throughout the business
- Take these five critical steps to get your data ready for AI
Microsoft Power BI

This is a data analysis platform by Microsoft. It provides options to perform data analysis and present results in a single dashboard. It provides support for many data sources and can be distributed as an app.
- Get self-service analytics at enterprise scale
- Use smart tools for strong results
- Help protect your analytics data
Dotnet Report Builder
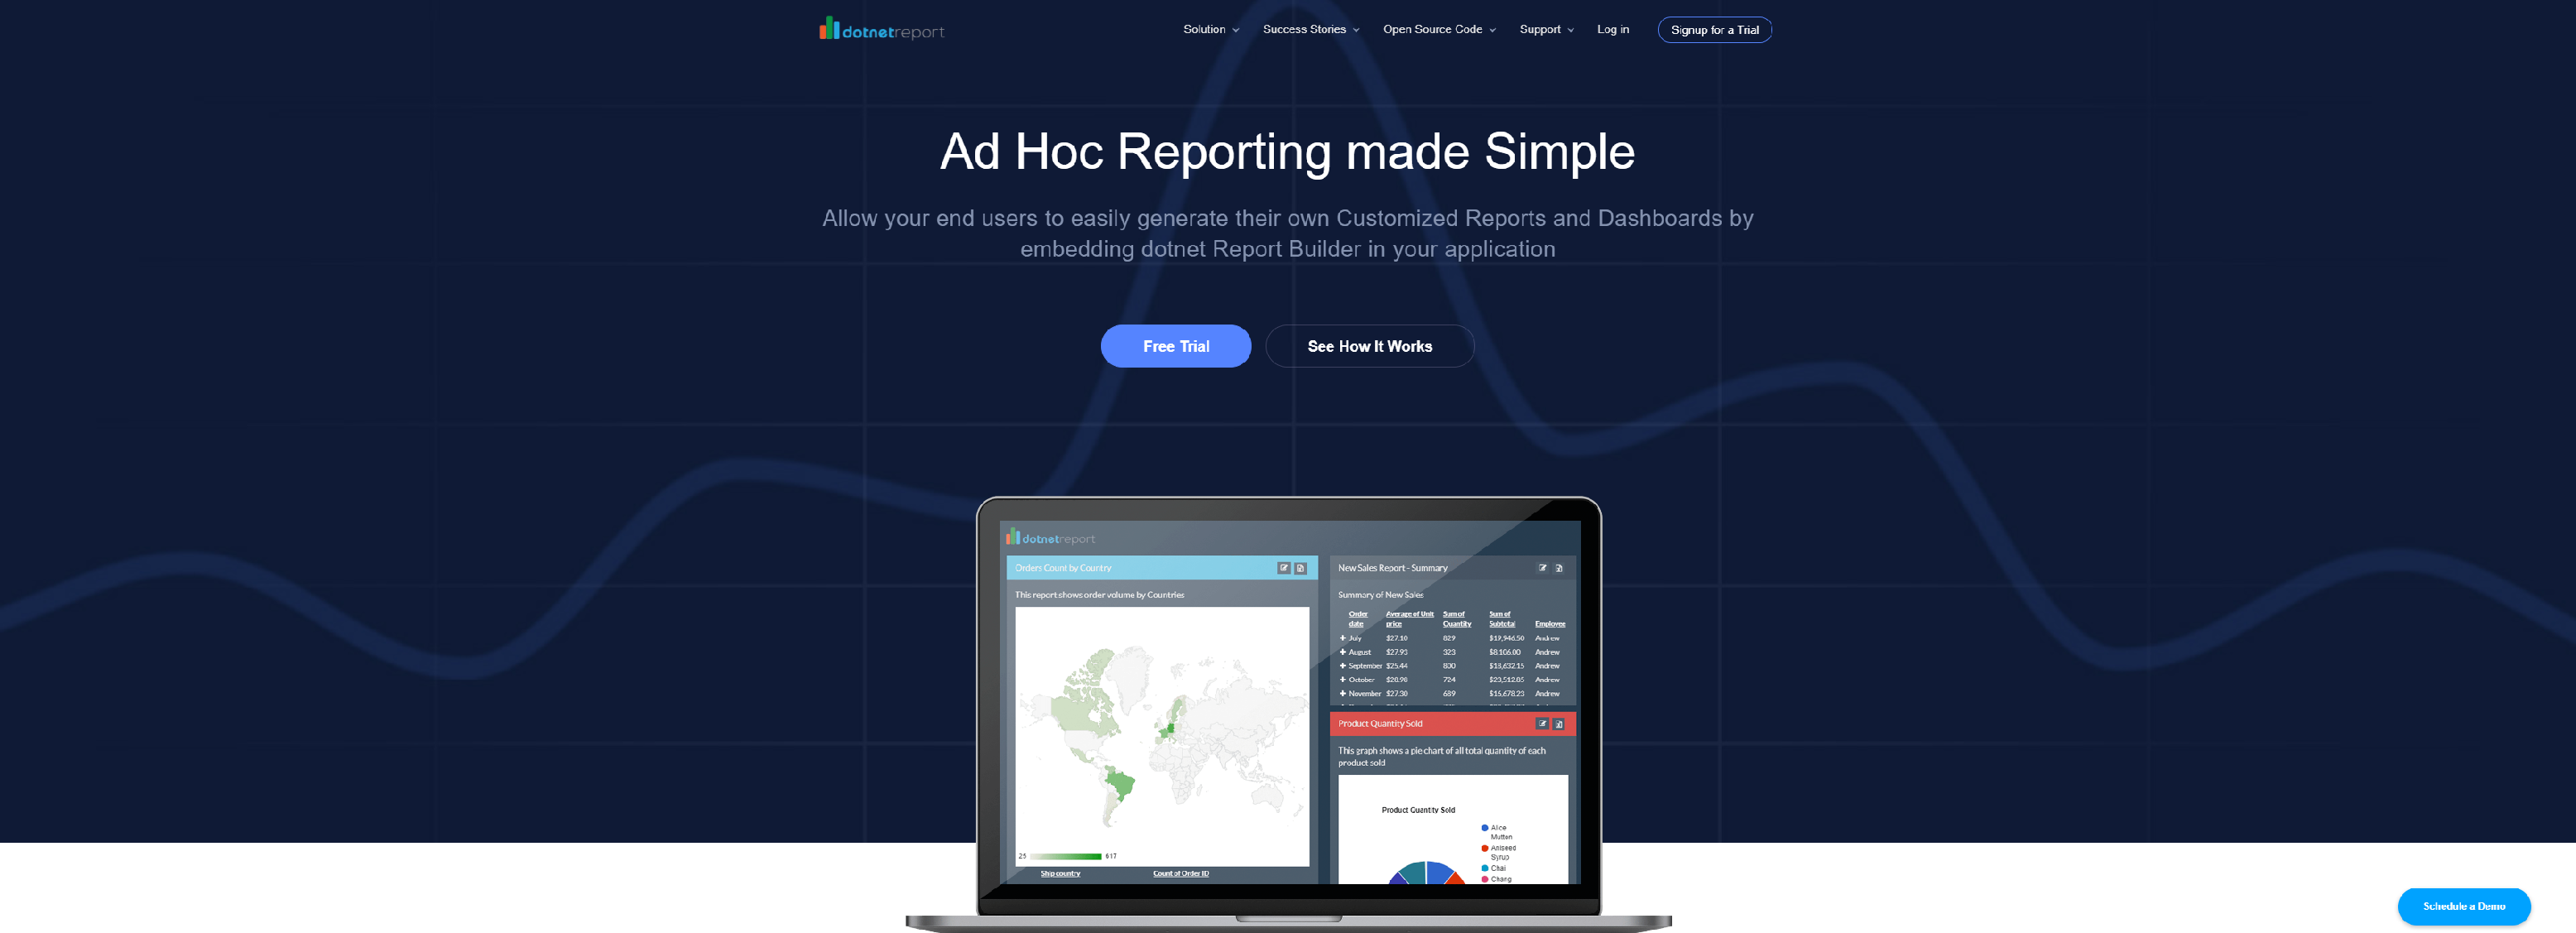
This is an ad hoc reporting software that can integrate into your existing software with minimum effort and give options to end user to perform data analysis by creating beautiful visualizations and reports from their own desktop.
- Easy to Install, Easy to Use
- Reports and Dashboards
- Schedule Reports
- Multi Tenant Clients, Users & Roles
- On Prem Hosted or Cloud Hosted
Sisense
Sisense is a data analysis platform that caters to both professional data analysts as well as simple end users with limited technical knowledge. The user can use a series of drag and drop options to design and run reports for analysis.
- Fuse your data and strategy together
- Connect data from anywhere
- Analyze and explore data, with or without code
- Augment with machine-learning
- Infuse intelligence everywhere