The Application Performance Management technology (APM) landscape has constantly been changing. Application Performance Management tracks the functionality of software programs and pinpoints quality issues as a benefit to users in the era of information technology. Factors like loading speed, application responsiveness, etc., can be utilized to measure APM.
Applications are growing more and more widespread and complicated in today’s world, thanks to technology. As a result, it’s important to keep an eye on the app’s efficiency to satisfy the user.
APM tools are the backbone of your application performance management. Choosing the right one can be tricky, especially with the many APM monitoring tools available today. With the right tool, you can fix performance issues as they happen.
For this article, we gathered real, verified user feedback from portals like G2, Capterra, Softwareadvice and more to form a detailed list about best APM monitoring tools.
What is APM?
Application performance monitoring (APM) tools are used to monitor the performance of applications and identify potential issues that could impact the user experience. APM tools can provide detailed performance information about an application, including response time, load time, error rates, and more. This information can help to identify and diagnose performance issues and can be used to improve the overall performance of the application.
Application performance monitoring tools are used by digital teams to examine and solve the numerous factors that might affect an application’s performance. Without these tools, organizations find it difficult to fix the many issues that could occur, which increases the risk that users will become upset by the negative experience and uninstall the app entirely.
Top APM Tools in 2022
Looking for the best APM tools to help you manage your applications? Check out our list of the top APM monitoring tools for 2022. We’ve evaluated the features, and pricing of each tool to help you find the right one for your needs.
1. Middleware
Middleware is a real-time, cloud-native observability platform that analyzes, diagnoses, and predicts issues across your entire stack. It keeps track of every last line of your code, so you can be assured that your system won’t be facing any unwanted downtime due to errors.
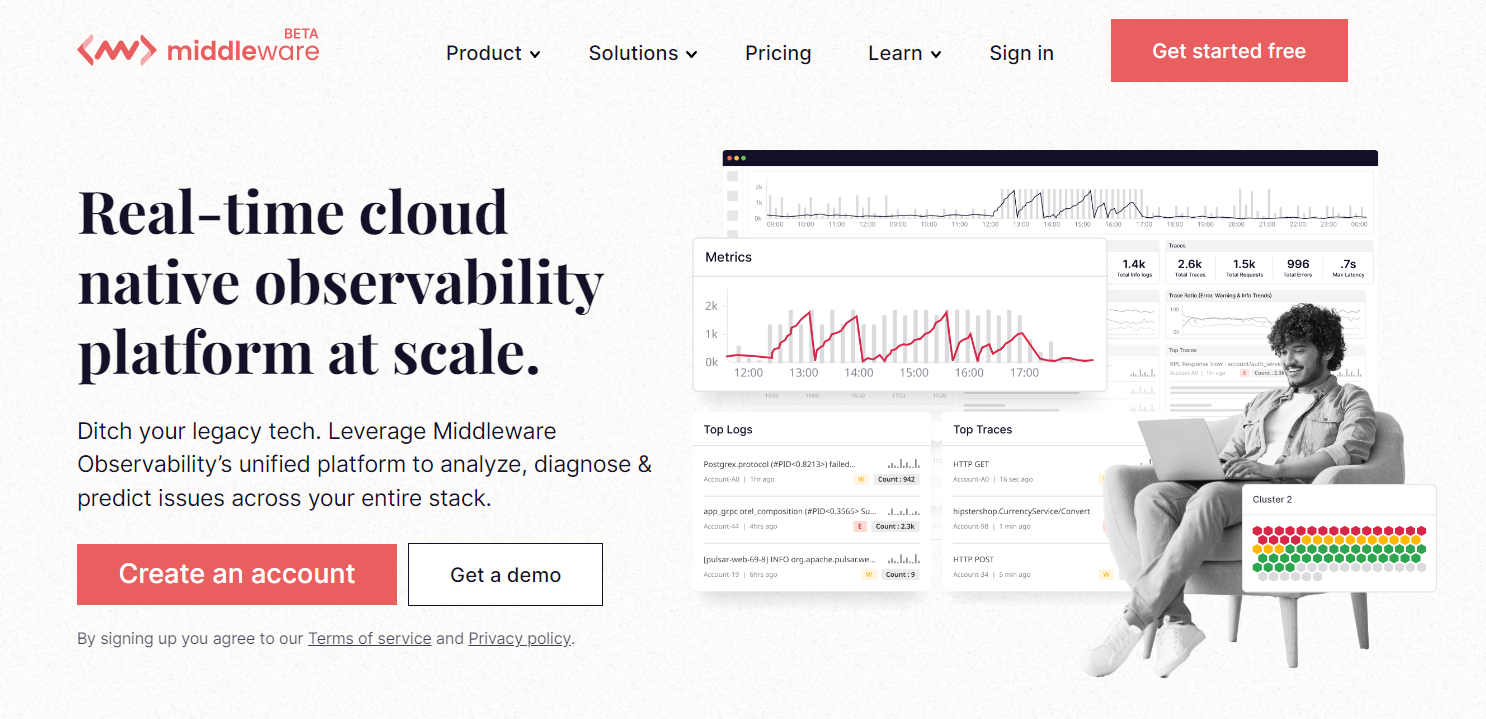
Middleware’s APM gives you insights into all of your services, logs and traces in real-time with distributed tracing. The tool provides a unified dashboard where you can see your service’s performance along with data like latency, errors, API calls and many more.
Features
Performance monitoring – Unwanted downtime can cost companies tens and hundreds of dollars. To prevent unwanted downtime, Middleware continuously monitors your application and its entire stack, so in case of any error, it will notify you with enough data to help you speed up your issue resolution time.
Distributed tracing – Middleware uses its own agent for distributed tracing so that you can get an eagle-eye view of all the traces with parameters in one place.
Error tracking – Middleware comes with an error tracking feature that allows you to view insights of your errors and keep track of your errors. These feature serves a great need when you are diagonalizing issues.
Price
The entire platform, Middleware, is free to use for now. Give it a try!
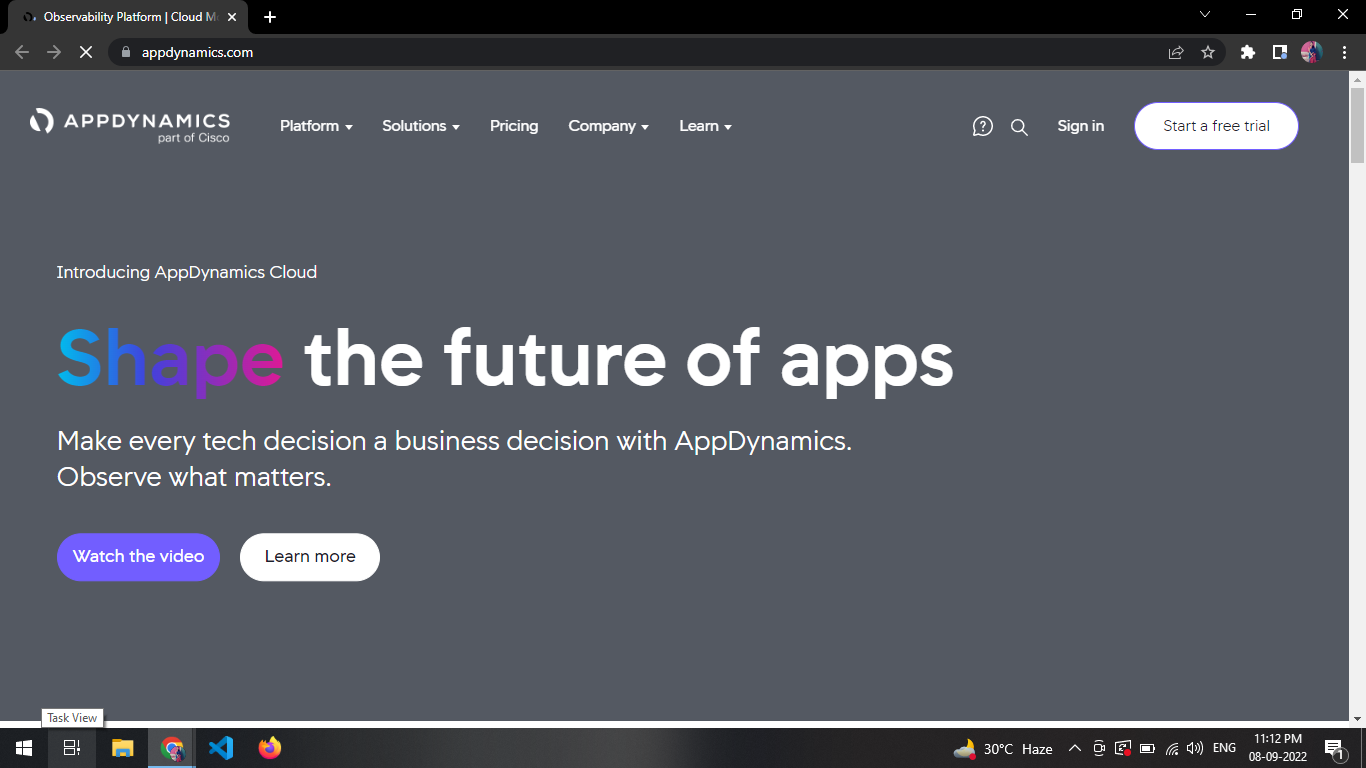
2. AppDynamics APM
AppDynamics is a cloud-based application performance management (APM) solution that provides real-time visibility reliability for widespread, complicated application software. By keeping track of each and every line of code, it fixes quality issues with production applications and enables the underlying cause of any problem to be found and rectified.
It monitors and manages your Java/JEE, .NET, Node.js, PHP, Python/Django, and other applications to deliver insight into application quality and user experience – from development through production.
Features
Performance of your Application – Customer application difficulties can significantly influence their online experience and, consequently, your image of the business. In order to achieve contractual agreements, it is crucial to prevent downtime that interferes with or interrupts a user’s experience.
CPU performance – Computer programs’ commands are carried out by the CPU- the central processing unit. Any decline in CPU performance can significantly impact memory use and the read and write operations of a disk. To prevent these problems, AppDynamics monitors CPU utilization data.
Error monitor – AppDynamics searches for flaws that cause procedures to fail while memory-intensive activities are running, such as HTTP requests. This allows you to monitor web requests that can lead to problems impacting your app.
Price
Choose from four plans as per your requirement:
- Infrastructure Monitoring plan- $6 per month
- Real User Monitoring Plan – $.06 per month
- Premium Plan- $60 per month
- Enterprise Plan- $90 per month
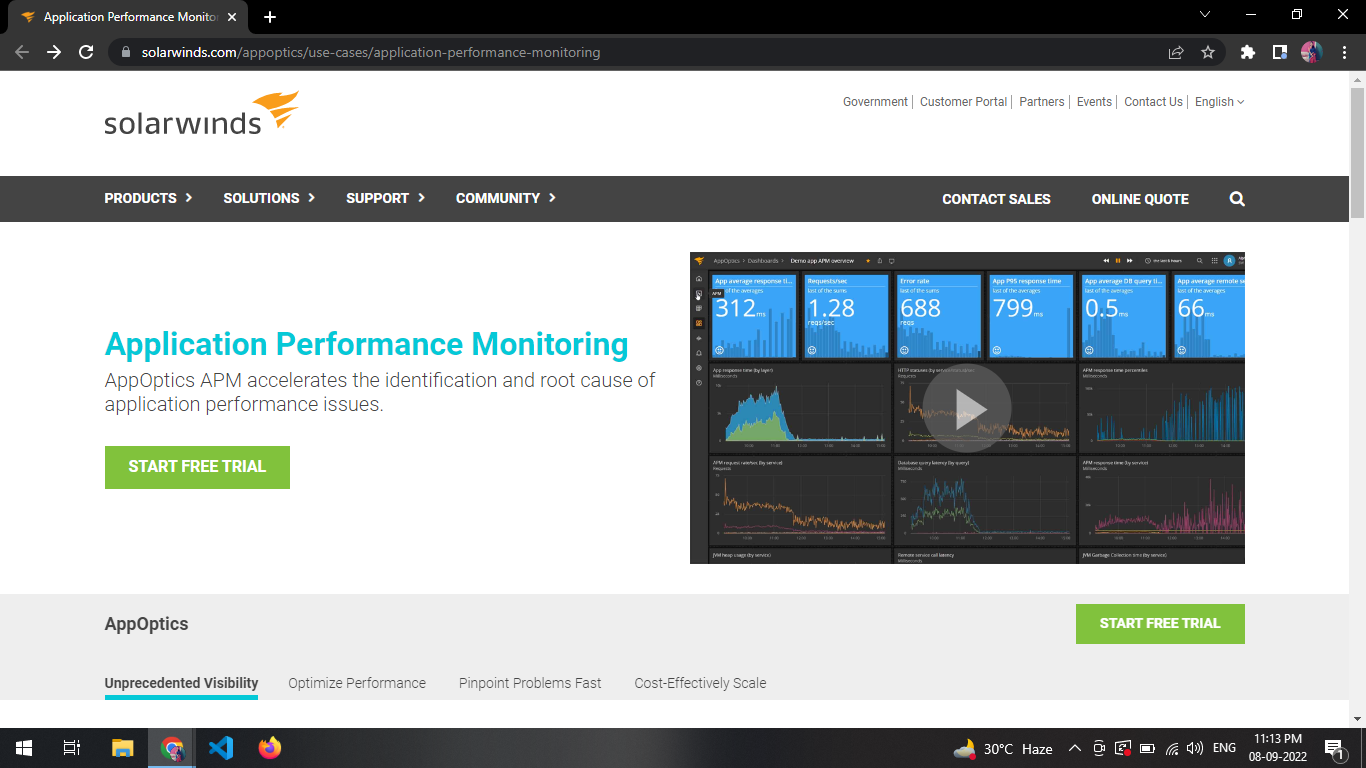
3. Traceview
It was once known as Tracelytics before being purchased by AppNeta and becoming a member of SolarWinds. SolarWinds was established in 1999 and is based in Texas, USA.
It is one of the top APM monitoring tools. It gives users an improved end-user interaction, significant transparency into the program, and a highly cost-effective application performance monitoring tool.
Features
Application Service Map – The effectiveness of an end-user can be analyzed in detail by using this APM tool. You can dig down into a specific service using its service map to analyze performance reports in further detail.
The Service Summary Report – The service overview report assesses service statistics dynamically and gives a clear description of delays, failures, peaks, and other data. The service summary category contains CPU usage, responsiveness, and the 4 key signs of performance metrics. The summary window lets you know if your activities are functioning regularly and, if not, what the root problems are.
The trace summary – The trace summary analyzes each transaction automatically and identifies the areas in which the service is using the most resources. The updated trace summary page will let you know which procedure was sluggish when used in conjunction with real-time code monitoring.
Price
Contact the Sales Team for price details.
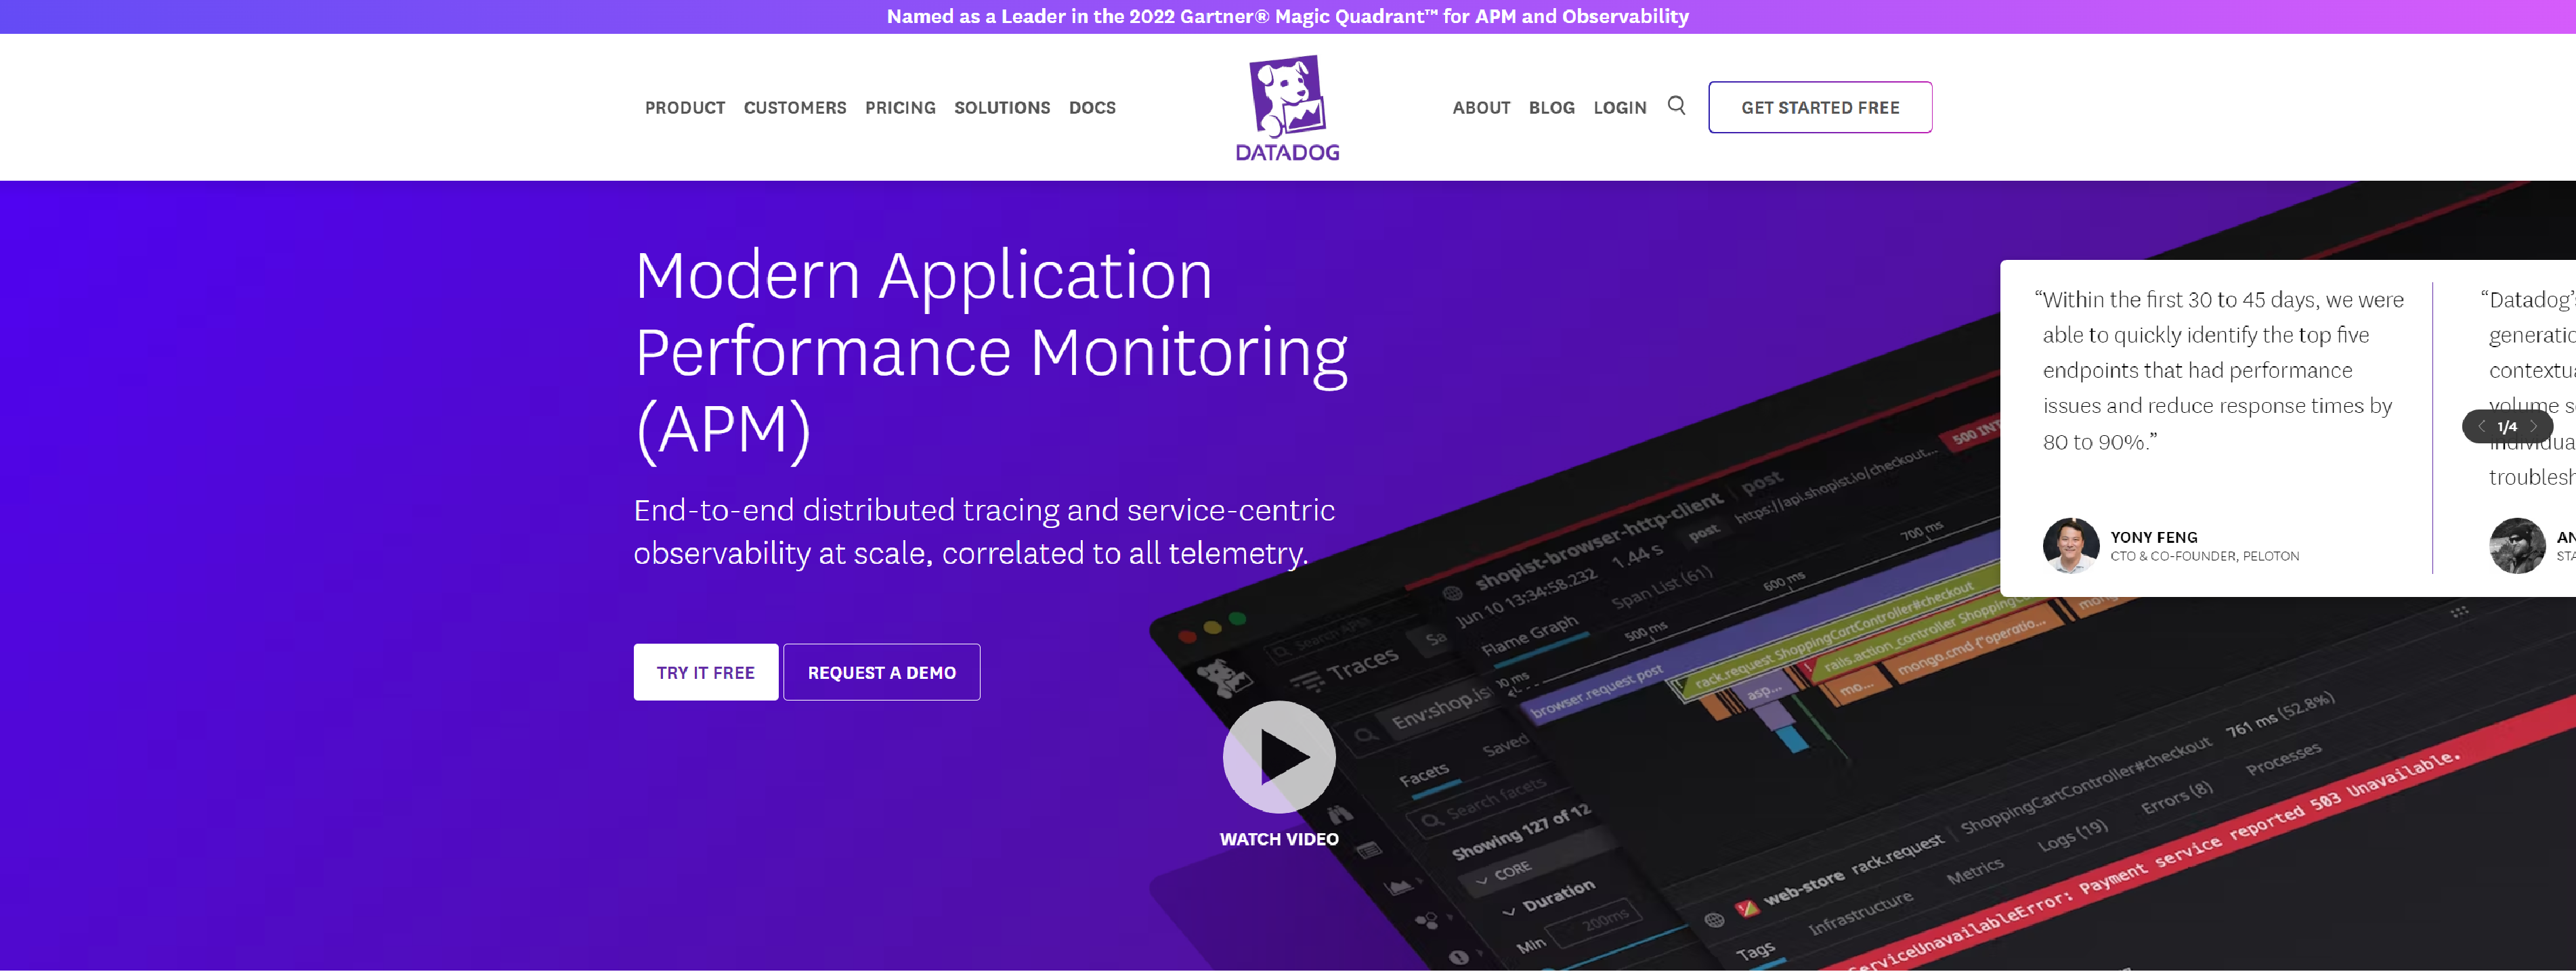
4. Datadog
Datadog APM’s distributed tracing visualizes latency across microservices and end-to-end transactions. Visualize requests, pages, user journeys, API calls, and more; get alerted to problems as they happen, and use powerful analytics to correlate performance anomalies with business metrics.
With Datadog, you have the visibility to make better decisions about what to build, when to build it, and how to improve your app.
Features
Performances Monitoring – With real-time insight into all imported traces and application dependencies, issues can be investigated more quickly.
Increase App Performance – By tracking profile agglomerations of services and destinations and looking for inefficiencies in your code, you can increase app performance.
Service Dashboards – Identify anomalies in error and delay with pre-built service dashboards.
Price
Contact the Sales Team for price details.
5. Sematext APM
Sematext improves application performance by monitoring business and customer operations in real time with end-to-end transparency to identify the app’s slowest and least responsive areas. It examines the interactions between apps and their supporting files, databases, and third-party services. Through quicker debugging, it enhances user engagement.
Features
Real User Monitoring – Monitoring statistics from real-time user experiences will raise customer satisfaction. They will help you find irregularities and immediately notify you. You can utilize data from legitimate user monitoring to improve the performance of your applications.
Transactional Tracing – With Transactional Tracing, you can analyze end-to-end transaction performance to obtain complete application performance insight.
Performance Visualization – A map-like portrayal of your overall application architecture is provided by Sematext APM to expedite the onboarding process.
Price
Choose from four plans as per your requirement:
- Logs plan- $50 per month
- Monitoring Plan- $.005 per hour
- Experience Plan- $9 per month
- Synthesis Plan- $2 per month
6. Dynatrace
Dynatrace seamlessly monitors your dynamic cloud applications, infrastructure, and digital properties to provide real-time visibility into the end-user experience. With a unified view in the Dynatrace platform, you can optimize your users’ experience, improve customer satisfaction and retention, and increase revenue.
Features
Application Performance – With Dynatrace, the performance of the application is ensured, innovation is accelerated, collaboration is effective, and more value is delivered with a fraction of the work.
Infrastructure, cloud, and container monitoring – Seamless auto-discovery and enhanced observability in virtual and hybrid settings.
AIOps – Dynatrace’s AI actively searches for issues and identifies their specific root cause.
Price
Choose from four plans as per your requirement:
- Full Stack Monitoring plan- $74 per month
- Infrastructure Monitoring Plan- $22 per hour
- Digital Experience Plan- $11 per month
- Application Security Plan- $15 per month
- Open Ingestion Plan- $25 per month
- Cloud Automation Plan- $0.10 per month
7. Instana
Instana – the APM solution that empowers organizations to experience real business value. It is a SaaS solution that monitors applications in any environment, providing unparalleled insights into application performance. Instana’s unique approach delivers complete observability and performance metrics, allowing you to achieve faster issue resolution and accelerate speed-to-market.
Features
Faster software development – Rapid application development and deployment cycles while you keep up with the alterations to your infrastructures and apps that are occurring dynamically.
Single Agent – To handle sensors, which are brief programs designed to keep an eye on every technology in your application, Instana employs a single agent. Without requiring any human monitoring, the agent customizes, loads, and maintains the sensors to gather configurations, modifications, statistics, and events.
Perfect visibility – Perfect insight into the course of your application’s operation. At a range of one second, Instana gathers measurements and telemetry.
Price
Choose from two plans as per your requirement:
- Saas Plan- $75 per month
- Self-hosted Plan- $93.80 per month
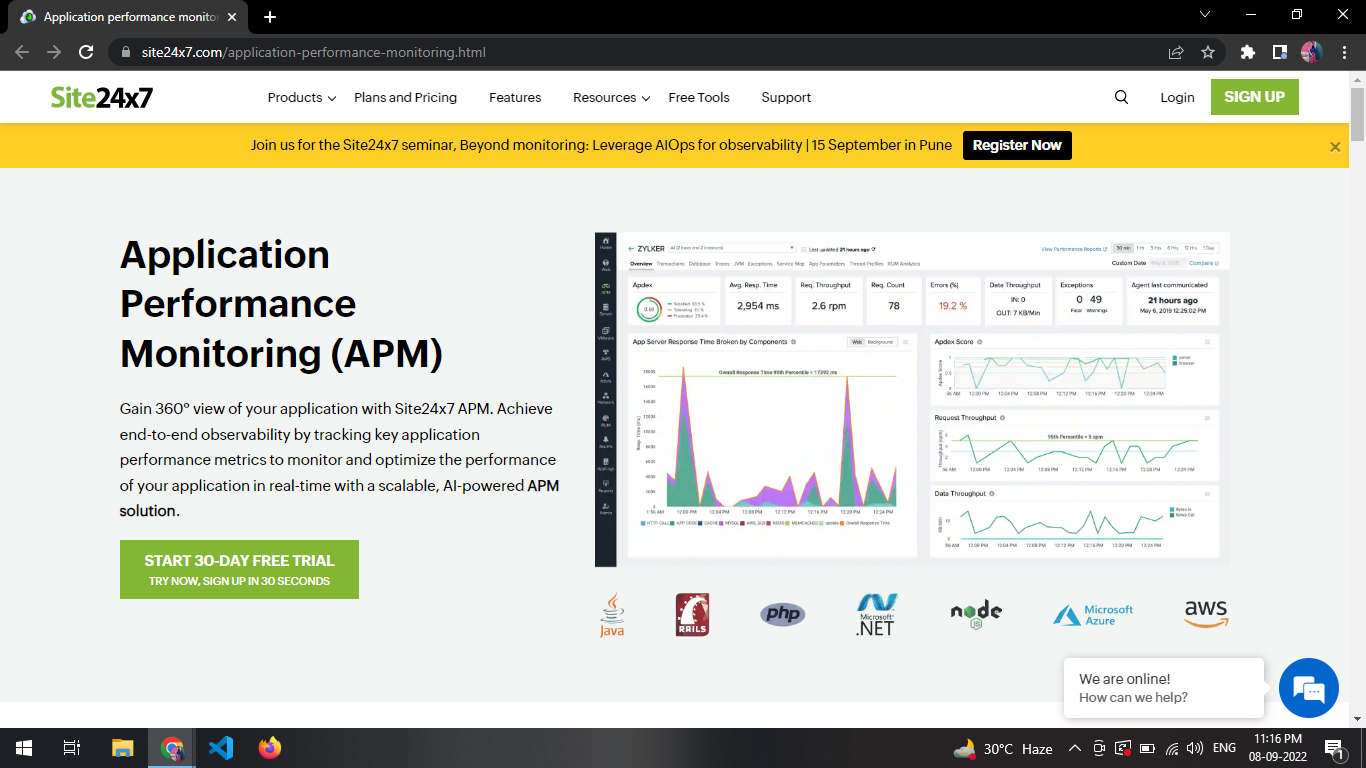
8. Site24x7
Achieve full visibility into the health and performance of your application with Site24x7, a complete solution that provides end-to-end observability across multiple layers of your infrastructure, starting from code right to the application and cloud resources. It is an AI-powered, scalable APM solution that gives you a 360-degree view of your application in real time.
Features
Supported Platforms – Find out in-depth information on the health of your apps operating on several platforms, including Node.js, .NET, PHP, Java, and Ruby.
Application Performance – Along with metrics from your cloud environment, track the performance indicators for apps that leverage a variety of offerings on Microsoft Azure and AWS.
iOS and Android – Find out the precise performance data for iOS and Android-based mobile apps. Improve the end-user service by fixing problems as soon as they arise.
Price
Choose from four plans as per your requirement:
- Starter Plan- $550 per month
- PRO Plan- $2100 per month
- Classic Plan- $5350 per month
- Enterprise Plan- $13450 per month
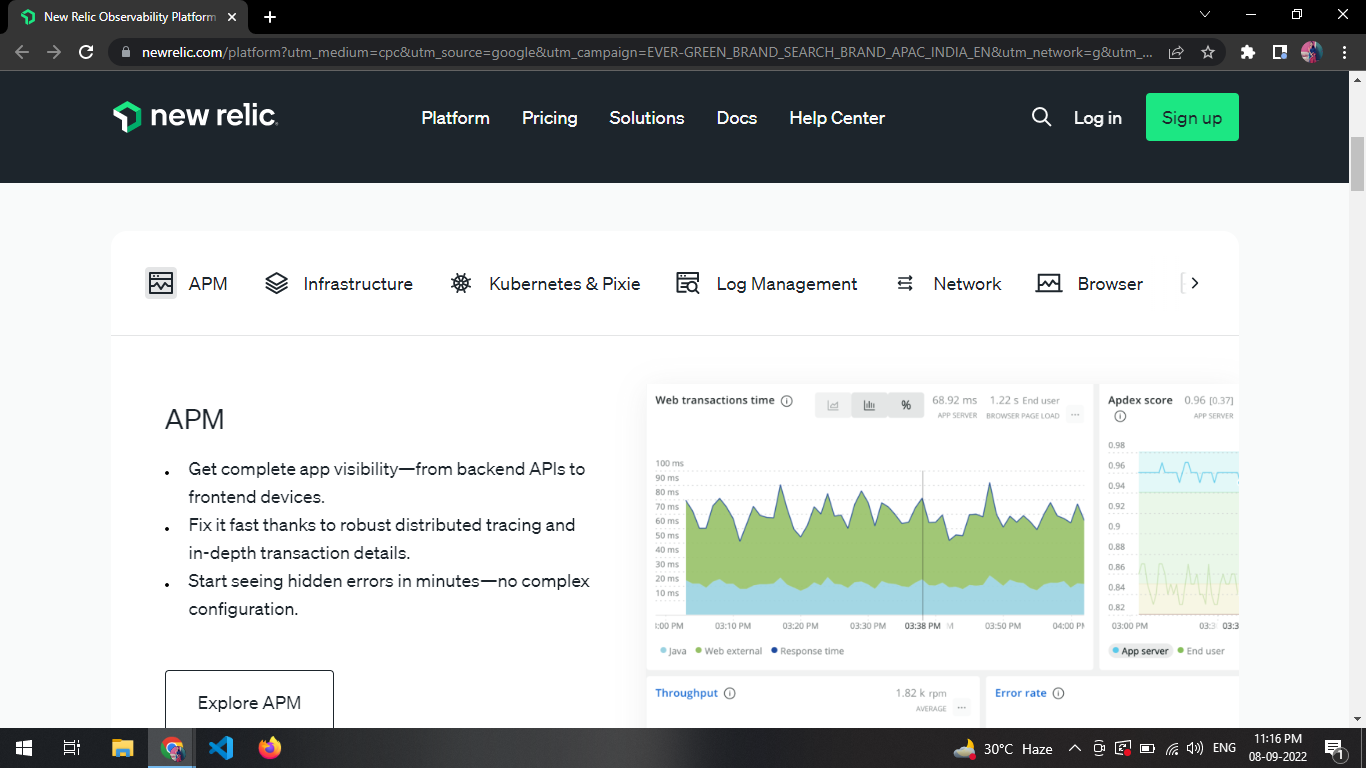
9. New Relic
New Relic is a cloud-based APM platform that provides analytics, insights, and reporting for your entire application environment.
Features
Simple to Setup – New Relic is simple to implement. No difficult configuration, hardware upkeep, or additional labor is required. Simply register for free, then start consuming data to track your stack.
One interface, hundreds of integrations – Develop data-rich dashboards, monitor, assess, and access information, and set alerts for all of your services on a single linked platform.
Price
Visit New Relic Platform for price details.
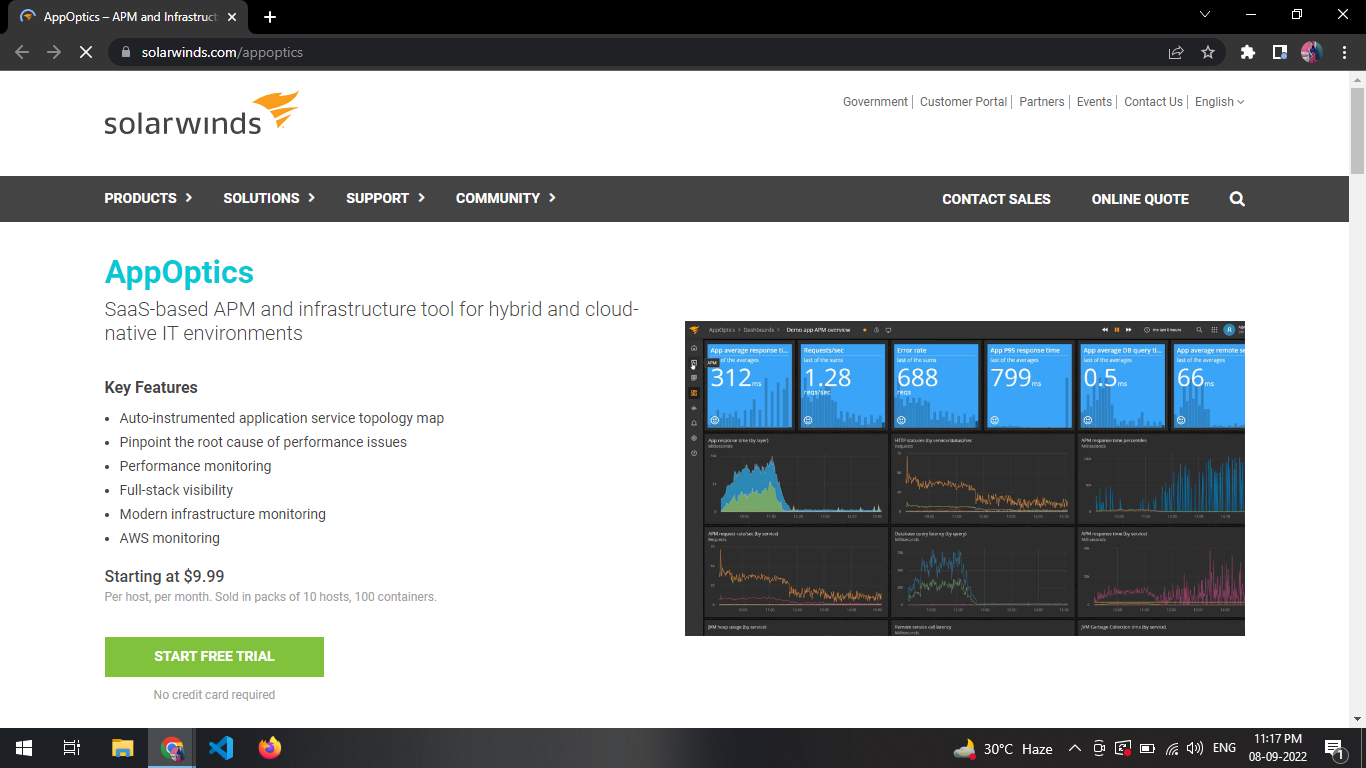
10. SolarWinds AppOptics
For specialized on-premises, cloud, and hybrid systems, SolarWinds AppOptics is a potent SaaS-based application monitoring solution.
Features
Application service map – The purpose of the service map is to contextualize how the performance of an end-user is affected by a service or dependent. You can navigate to a specific service using the application service map to get additional in-depth performance information.
Full-stack Visibility – Use a single dashboard to compare application and infrastructure data side by side.
Performance Monitor – The performance of apps, interactions, processes, hosts, and microservices, are all thoroughly and broadly inspected by AppOptics.
Price
Choose from two plans as per your requirement:
- Infrastructure & Application Monitoring Plan- $24.99 per month
- Infrastructure Monitoring Plan- $9.99 per month
How to Choose the Right APM Tool
Once your requirements are apparent, you should try to align them with the APM monitoring tools that are currently on the market. An application performance monitoring tool that alerts you to a sluggish operation but cannot explain where, how, or who should take responsibility for fixing the problem is essentially worthless.
In order to evaluate and compile data from practically all the main service providers, a decent APM solution should have a broad selection of integration gateways.
Conclusion
There are several APM tools on the market, and you may select the one that best matches your business and your needs. As this is only the beginning of your investigation into APM tools, the capabilities of the tools go far beyond the list.
Therefore, if the capabilities of the aforementioned tools appeal to you, be certain to learn more about them on their official sites.