Analysis of survey data aims to extract insights that are useful for making business decisions.
While nowadays anyone can create a questionnaire, post it online and invite people to take the survey, not everyone can do a proper survey data analysis. In fact, our records show that some 74% of all do-it-yourself online surveys fail to deliver professional information because:
- 65% of the analysts do not have deep enough data analysis know-how
- 54% do not use proper analysis tools
- 37% get lost in analyses, because they lack an analysis plan
Survey analysis begins before the questionnaire is created
Before you create the questionnaire you should already know what you want to find out and how to extract that information from the data you are going to gather. We call this the Analysis Plan.
Even before you engage with the analysis plan you should decide whether you can do it yourself or you need the help of an expert analyst. When the survey study is important, having an expert analyst at your side is the option to choose.
An analysis plan is a roadmap that describes goals and organizational details. It comprises three key components:
- Data treatment
- Cross tables
- Advanced data analysis
Data treatment
What are you going to do with the raw data you gather from the survey respondents? First of all, you have to prepare it for the analysis, and there are several things to accomplish. The data treatment section of the analysis plan explains who performs the following tasks, when they do them, and in how much time:
- Cleaning errors. Also called Editing, this phase aims to remove improper answers from the database. For instance, if respondent X answers “No” to the question “Do you speak a foreign language?”, and the same person answers “Translator English to French” for his or her main job, we should investigate whether the answers are coherent and eventually fix the problem.
- Coding open-end questions. This is perhaps the most important kind of question asked in a survey, but it has the disadvantage of requiring coding of the answers in order to be analyzed properly. Open questions are often pre-coded, for instance using a multiple choice answer scale, but this is a very bad habit because the question may fail to capture the top of mind thinking of respondents. In other cases, questions are left untreated and presented in the form of citations, which can lead to confusion in the reader’s mind (think of reading 300 citations) and useless results. The only way to use open-end question properly is by coding the answers to produce numerical tables. In most cases you need an expert analyst to do a proper coding job.
- Deriving variables. Sometimes you want to group, say, countries into continents or ages into age classes, and so on. Asking two questions is not always a good idea, so you may need to treat the raw data to derive new variables. In these cases, be careful that the new variables are accurate; it is easy to make a mistake in this process.
- Computing indexes. Indexes are very useful for compressing a lot of information into one single number that can be used to make comparisons. For instance, you ask men and women how satisfied they are with their working relationship with their boss. The answers may be gathered using a scale ranging from 1 to 10, or with a Likert’s scale going from Very Satisfied to Completely Unsatisfied. How can you say, quickly, which group is more satisfied? Using an index, for instance ranging from 0 to 100, or -100 to +100. You can of course compute such indexes by hand using a spreadsheet; however, chances are you may make mistakes, and you will need a lot of time. Using a dedicated software tool is a better solution, but you must be ready to learn it, which may take time, and to pay for it, which may involve a significant amount of money.
- Formatting the database for further use. When the data is clean and correct you can put it in the right format to start the analysis. That is, you put the data in a database with columns and rows properly arranged as required by your elaboration software.
Crosstabs from survey data
(also called contingency tables, pivot tables, and crosstabs)
It is in the numbers of cross tables that you find the answer to the goal of the survey. Cross tables are the key output of a survey data analysis.
Many users of do-it-yourself surveys, however, miss this point completely, and work with totals only, such as how many men and women answered my survey, the number of respondents by age class, and so on. Such use of survey data is simply childish from the point of view of an expert analyst, because it looks at one variable (question) at a time. Professional analyses look at (cross) the results of two or more variables at a time.
Although you can make pivot tables in Excel, if you are serious about business decisions backed up by solid data you should use a software application specifically created for making contingency tables, such as MM4XL, SPSS, SAS, and the like. This requires time and money, but it carries the advantage of analyzing the data in a professional manner.
If you want to save time and money, ask an expert to make your crosstabs. The expert can even help you learn how to interpret and use the contingency tables correctly (remember, surveys often come from a sample, which requires interpreting the data in the light of the statistical error and confidence interval, a subject called inferential statistics).
What types of surveys?
In business you either have a problem or an opportunity. In both cases, marketing-oriented companies use business cases to authorize action plans, and everything is based on reliable facts and data drawn from Marketing Research, which can be of two main kinds:
- Exploratory
- Confirmative
Exploratory research is typically qualitative (unstructured) and uses focus groups, in-depth interviews with experts, literature reviews, anecdotes, and other unstructured forms of information gathering.
Confirmative research, a very broad subject, implies one or both of two methodologies called observation and questioning; it aims to describe, test, and estimate.
Although long known, observational research is experiencing increasing use because it can supply business people with very useful information. Among the most established and emerging observation techniques are:
- Ethnographic studies
- Test markets
- Eye tracking
- Mystery shoppers
- Visual inspection
Question-based research is perhaps the most widely used kind of confirmative marketing research. It uses questions to gather information from samples of respondents that reproduce a universe, for instance, users of webcams, readers of newspapers, buyers of canned beer, and so on. The list of question-based marketing research types is very long, although some studies are used more frequently than others.
| Study aim | Study kind |
| Descriptive studies | Satisfaction Study Usage and Attitude Study (U&A) Brand Image Study Comprehension and Reaction Study Overall Related Recall Study Change Awareness Study Change Usage Study New Brand Evolution Study Advertising Awareness Study |
| Marketing tests | Concept Test Blind Product Test Identified Product Test Parallel Placement Product Test Relaunch Brand Evolution Test Day After Recall Test Sensation Transfer Test Sniff Test Look and Handle Test |
| Estimation methods | Assessor Test Micro Market Test Price Test |
Every study, test and method has its own peculiarities, including advantages and drawbacks. One aspect common to all of them is the fact that you cannot accomplish everything with a single study. Managing brands and companies must rely on data coming from different sources, collected in different ways, accounting for different issues. Managers who are serious about fact-and-data driven business decisions develop a so-called Research Plan, to describe what information they need, for what purpose, and at what time during the management cycle. It may be a yearly or a 3- to 5-year plan, where you describe the gathering and consumption processes of the information you need to manage your business successfully.
Are DIY Online Surveys a Good Idea?
Nowadays, in a few minutes anyone can set up a do-it-yourself survey questionnaire, post it online, and start gathering data. However, a professional and useful DIY online survey may take longer to set up and will require technical knowledge to analyze the data properly. Before you engage in a DIY online survey, take a little time to consider its advantages and disadvantages.
Disadvantages of DIY online surveys
Questionnaire – A useful questionnaire is written with the goal of the survey in mind, which requires thinking in advance of the data analysis plan. Writing the questionnaire and programming it for online use may not only take some time, but also requires substantial technical know-how. The differences between a useful and a useless survey can be subtle, and the questionnaire plays a major role.
Respondent recruitment – Do you have contact addresses for the people you want to invite to take the survey (as you may have for clients or employees)? If you do not have contact details, chances are you need from the assistance of a company that specializes in recruiting respondents, and finding the ‘right’ partner for you may be time consuming and confusing.
Data analysis – Data analysis is perhaps the most critical factor of any survey, online or not. Most online survey providers (like SurveyMonkey, KwikSurvey, etc.) offer standard analysis tools, but most of these tools supply only very basic analysis functions, which are not adequate for professional surveys. Examples of issues you may be faced with include:
- Coding and analyzing open-end questions can become a nightmare
- Cross tables in most cases can only be made one at the time, and typically you need tens or hundreds of tables for a proper survey analysis
- You can only cross 2 variables at a time, while in many tables you may need 3 or more
- Standard analysis tools do not do statistical tests, like the significance of proportions, which is a key factor when analysing the results of, for instance, a concept test in comparison
- The complete lack of advanced analysis functions, such as segmentation tools, perceptual maps, and so on
Advantages of DIY online surveys
Cost savings – Needless to say, DIY online surveys cost much less than marketing research agencies charge. And in many cases, they also allow you to save time, while you keep tight control of the whole study.
Learning by doing – You work more, and you learn more. Leaving the whole survey in the hands of a specialized agency keeps you away from the technical side of the survey. Getting involved directly carries the advantage that you learn by doing, and the next time you buy the service from an agency you will be in a stronger negotiating position, because you know what the job involves.
Better business decisions – You will make better business decisions. Being able to gather insights quickly at a reasonable cost allows you to run more surveys, which means more of your business decisions will be backed up with facts and data, as opposed to gut-driven decisions.
International studies – Because multi-language and multi-country surveys may be extremely expensive, they are often avoided. DIY online studies can save you a fortune for these kinds of studies, and your sales will certainly profit from a better understanding of your business in-house as well as abroad.
NCSS
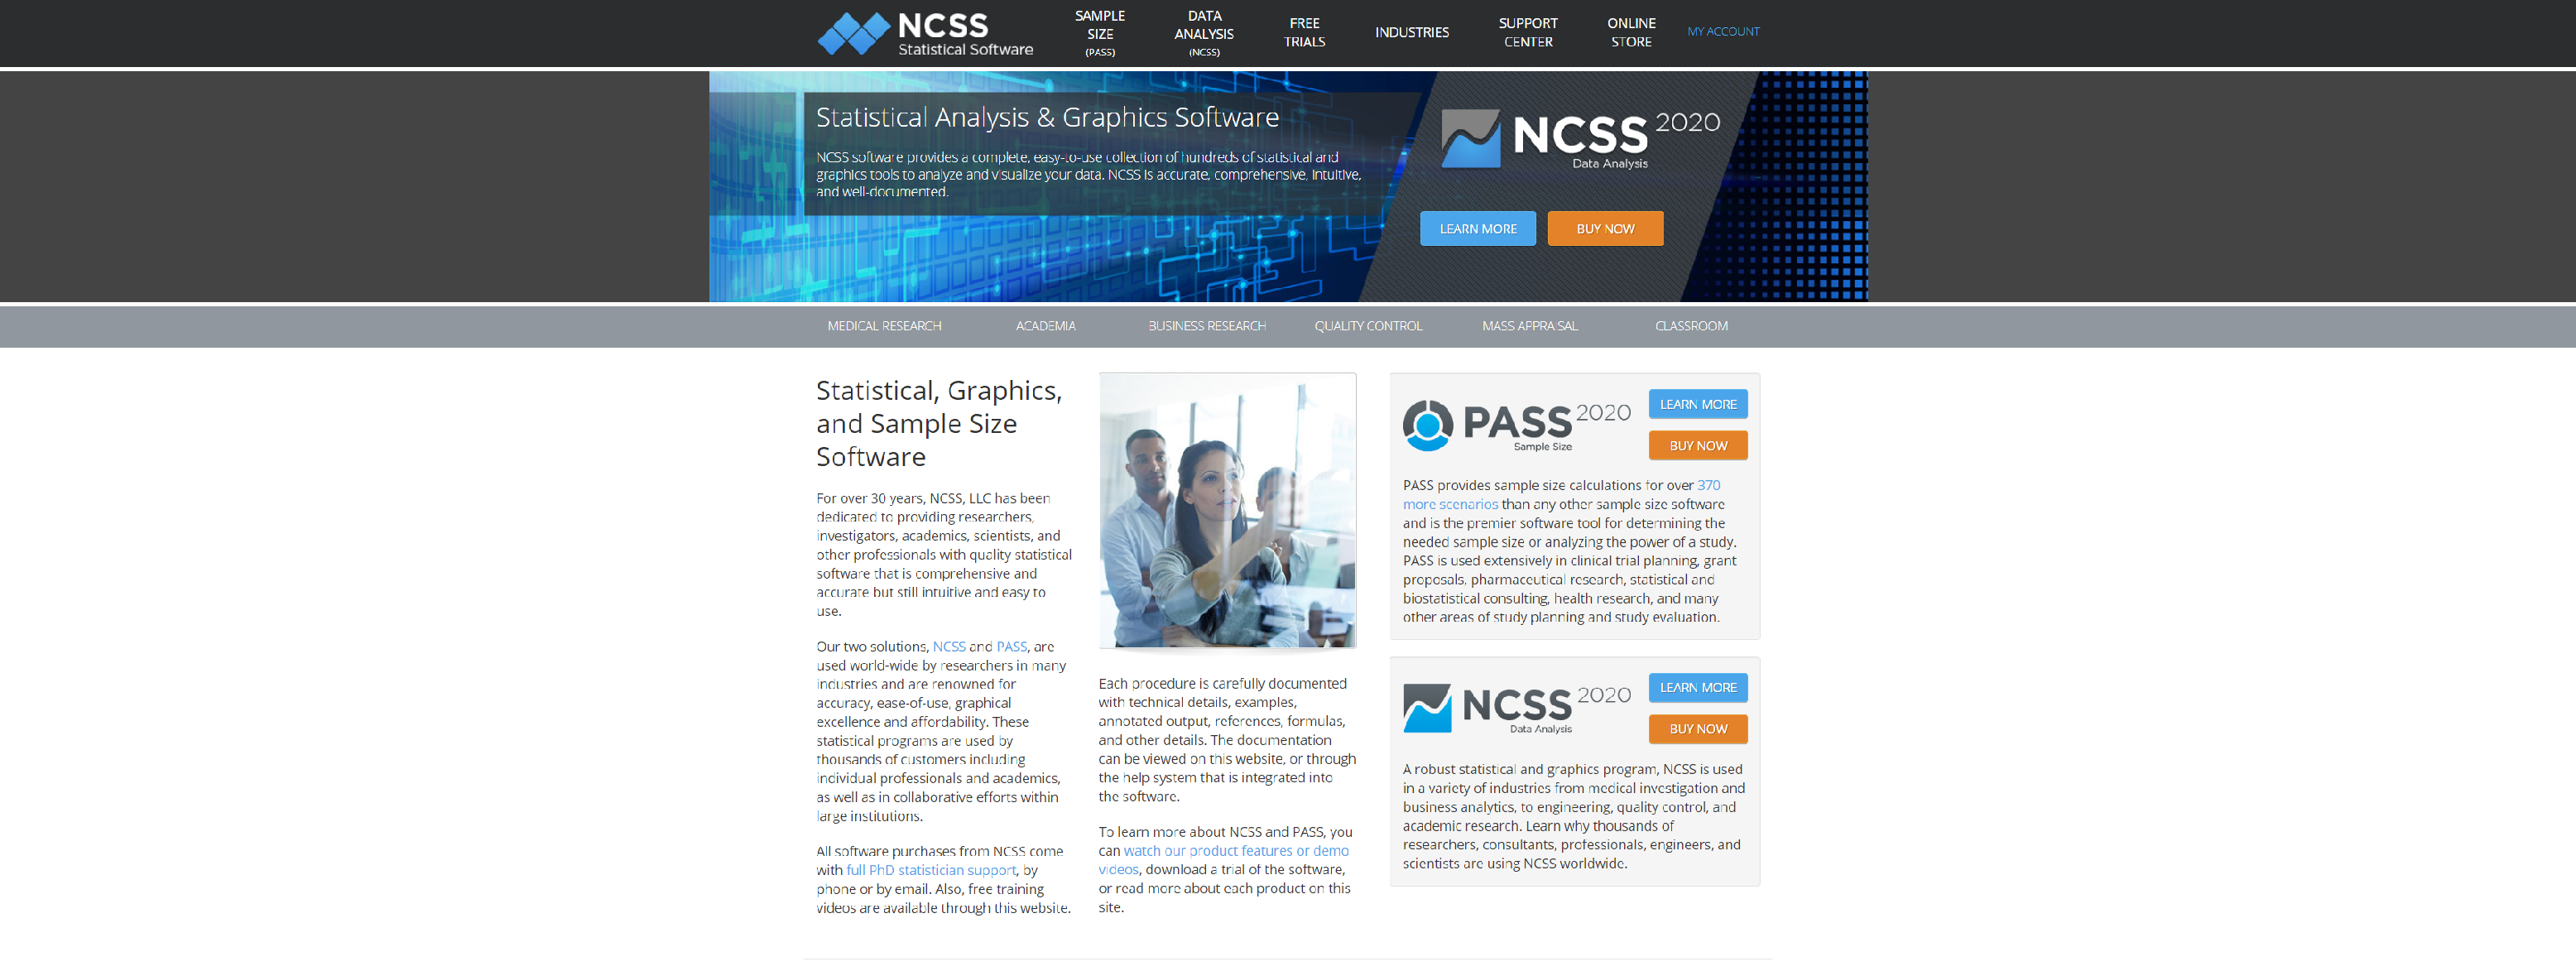
NCSS has a number of tools for summarizing categorical and continuous survey data, including descriptive statistics and two-way table analysis procedures.
- Data Analysis, Graphics
- Analysis Using NCSS
- Intuitive Data Management
- Choosing A Procedure
- Easy Analysis Set-up
- Elegant Plot Design
- Ready to Use Output
SNAPSURVEYS
Accredited market research and consultancy services for questionnaire design, data collection, analysis and reporting.
- Survey design expertise
- Templates and branding
- Complex questionnaire set up
SURVEYMONKEY

Survey analysis tools such as crosstab reports, filters, and sentiment analysis can help you get deeper insights for presenting survey results.
- Results summary
- Filter results
- Crosstab reports
- Combined filters
- Sentiment analysis
- SurveyMonkey benchmarks
MAXQDA
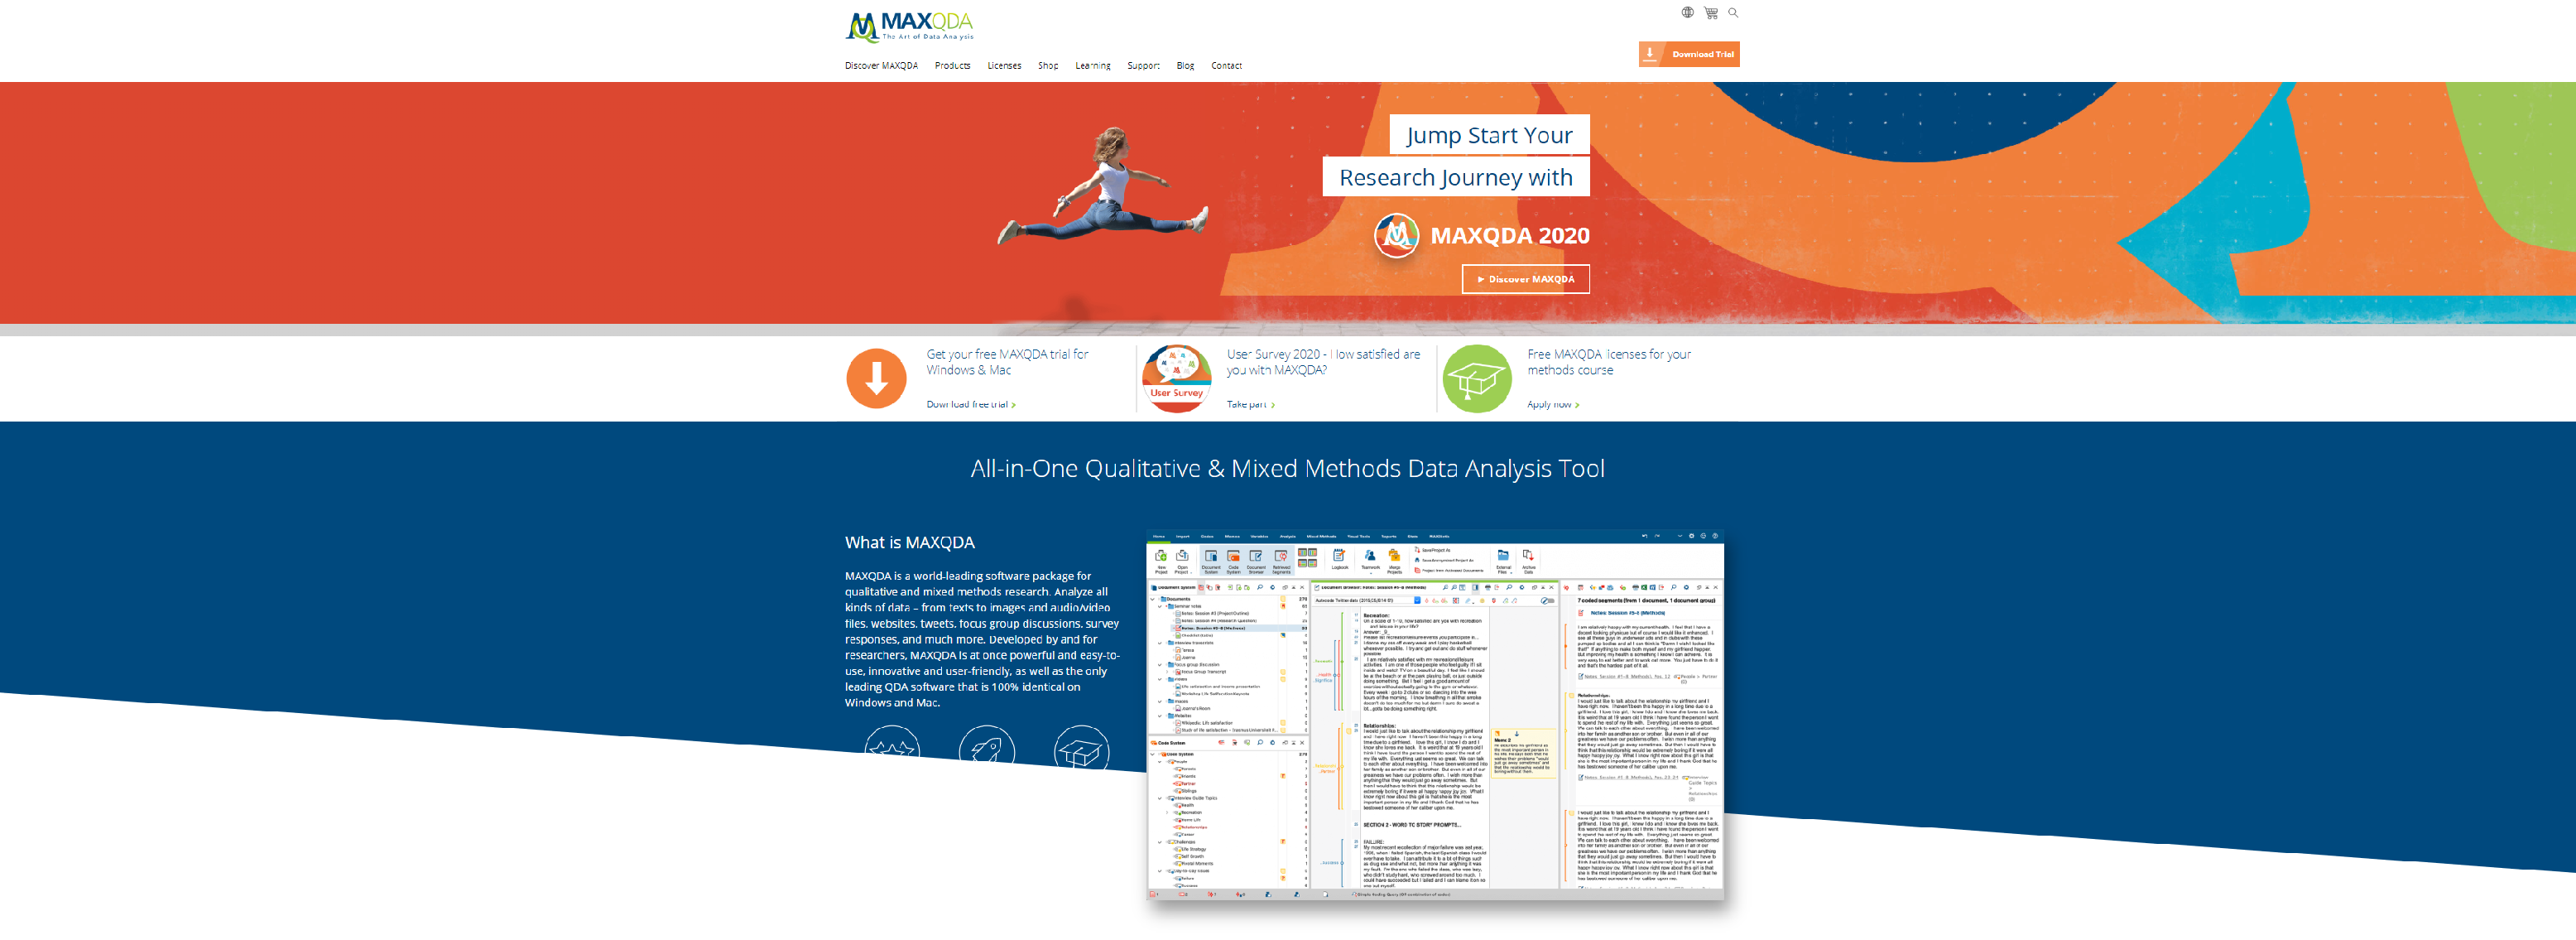
MAXQDA is the #1 Questionnaire Analysis Software and offers a wide range of survey and questionnaire data analysis tools. Easily analyse online surveys, answers to open ended questions, interviews, transcriptions, and more. Powerful, Easy to use, and relied on by thousands of researchers worldwide.
- All-in-one Questionnaire Analysis Software
- Direct Import from Survey Monkey, Excel & SPSS
- Organize your data and codes
- Categorize Survey Data
- Statistical Analysis with MAXQDA Stats
MTAB

mTab is a Survey Data Analysis Software & statistical analysis solution to turn survey data into insights. We make complex market research data meaningful & actionable to drive better business decisions.
- Visual analytics, dashboarding and storytelling
- Deep analysis and DIY advanced visualizations
- Take storytelling to the next level
- A single source of truth for all your research reports
SURVEYHERO
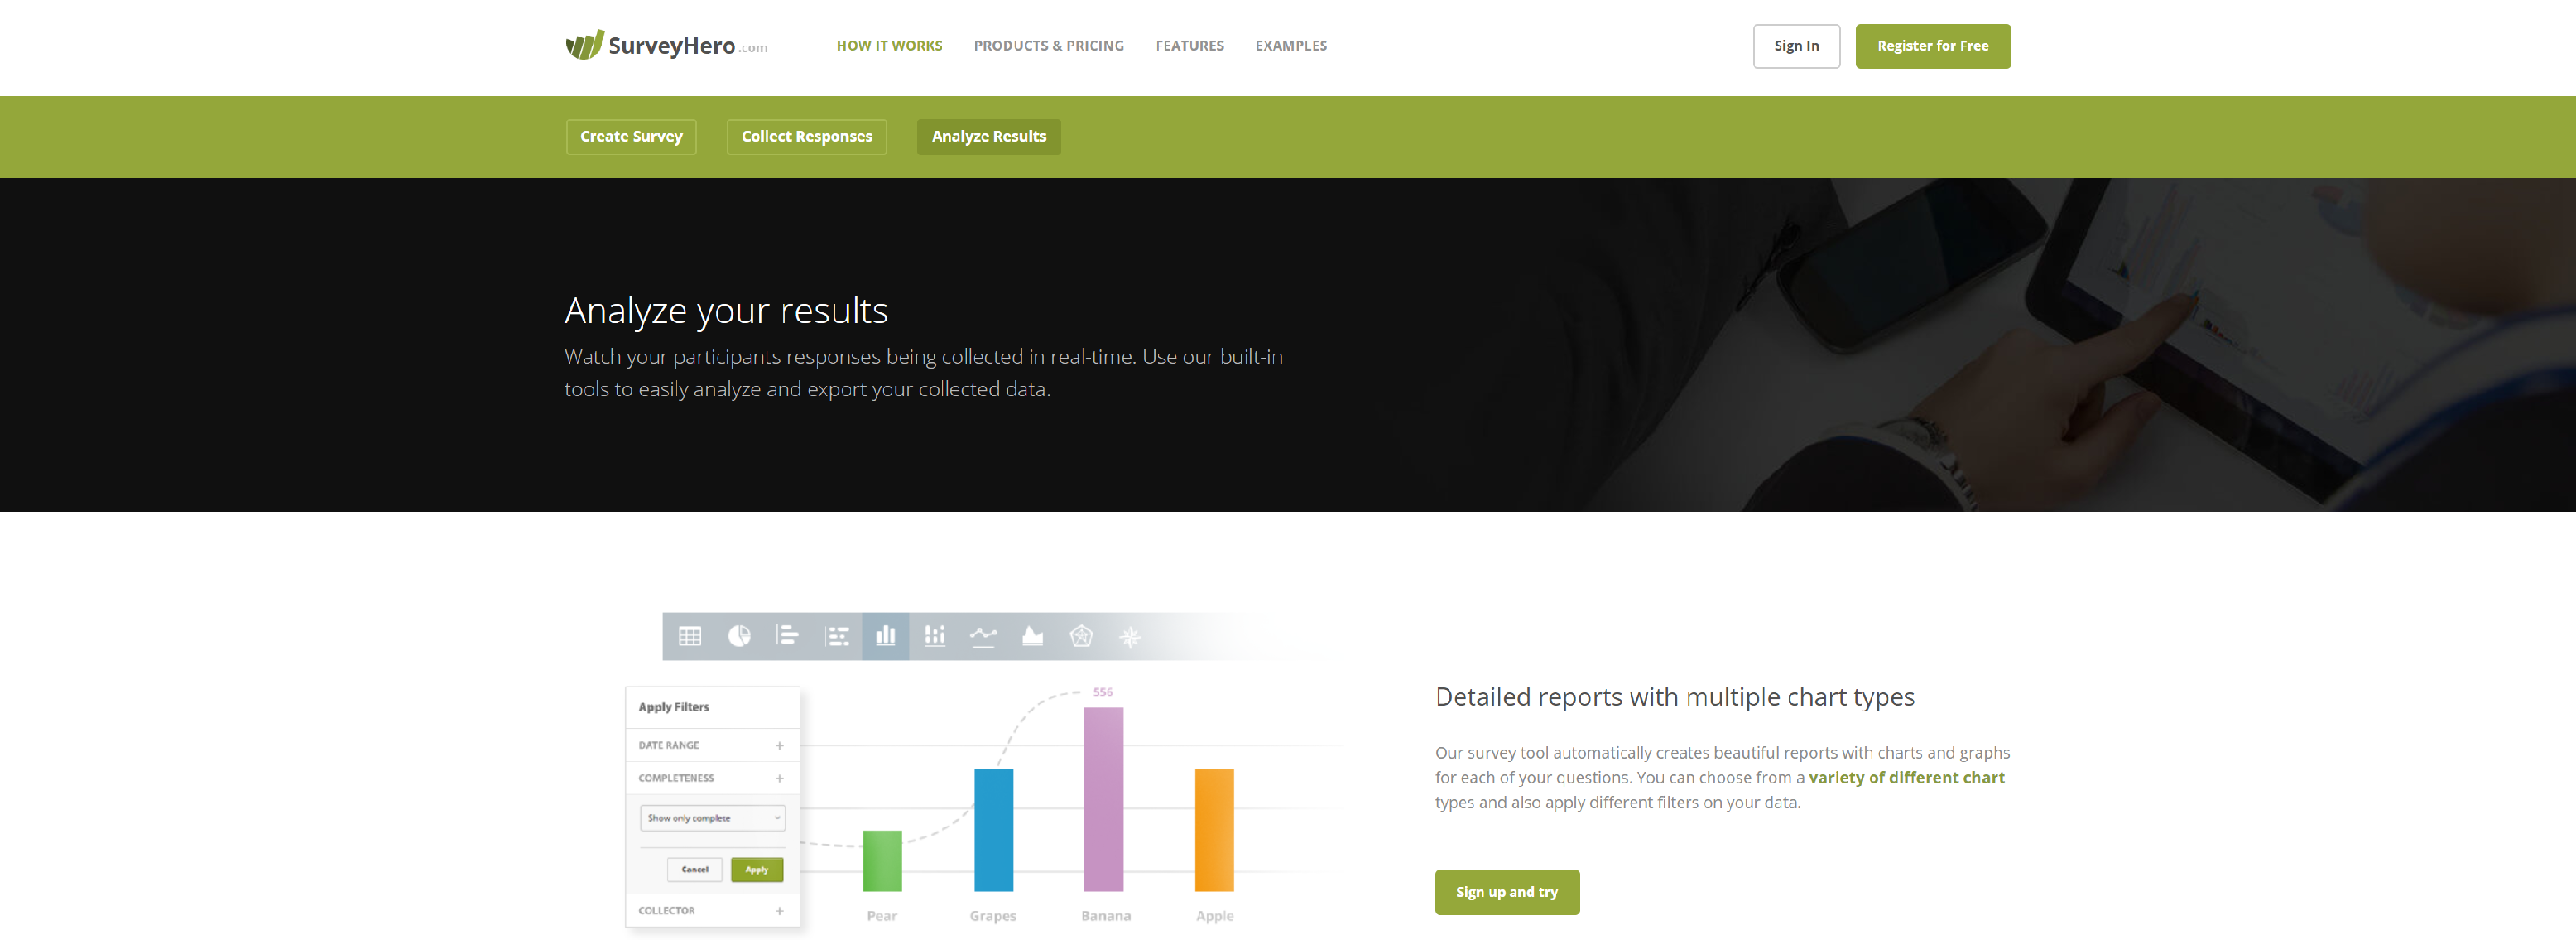
Watch your participants responses being collected in real-time. Use our built-in tools to easily analyze and export your collected data.
- Detailed reports with multiple chart types
- View responses one by one
- Export your data
DISPLAYR
Displayr is an all-in-one statistical analysis and reporting tool designed for survey data. Analyze, visualize and share beautiful dashboards & interactive reports.
- Easy updating and automation
- Full support of the R Language
- Simple to create and manipulate variables
- Statistical testing based on data type
SURVEYMETHODS
SurveyMethods provides powerful online survey software tool, advanced data analysis, email newsletters, and a comprehensive survey API.
ANSWERMINER
AnswerMiner is an exploratory and data visualization platform for marketing and business analysts to explore correlations, create dashboards and predictive analytics.
- Find Correlations
- Quick Visualizations
- Predictions Without Coding
- Data-Driven Decisions