Web server management involves getting timely and accurate feedback about the server performance as well as about the activities being performed on a web server. This is important to know about the potential problems that may be occurring in the server and take counter measures in advance. For this purpose log file proves to be a very useful information store providing data about server performances and activities.
The Apache HTTP Server comprises of highly comprehensive and flexible logging capabilities that aid server managers to analyze the data contained in the log files. To view and analyze the Apache log contents, special tools referred to as Apache log analyzers are being used.
Apache HTTP Server consists of two types of log files, namely, Apache Error Log Files and Apache Access Log Files. By default Apache creates all its log files in the Common Format; however, most hosting providers set the Combined Log Format for their Apache servers. The Common Log Format is considered the standardized text file format used in log file generation by web servers. Following is the syntax of the Common Log Format:
- Host ident authuser date request status bytes
Let us discuss the two Apache log files in details
Apache Error Log Files: The server error log file is the location where Apache HTTP Server sends all its diagnostic information and record of errors encountered during a processing requests. Whenever a problem occurs in the web server, apache error log file is the first place where analyzers must look for probable hints. Command line utilities such as “cat”, “grep”, “awk” and “sed” are used by server managers to access and find out the errors in Apache error log files. The error log format is descriptive and free-form, for example:
[Wed Oct 28 14:32:52 2000] [error] [client 127.0.0.1] client denied by server configuration: /export/home/live/ap/htdocs/test
Apache Access Log Files: Access log file is the location where the Apache Server records all the requests processed by it. The content and location of Apache access log files are controlled by the CustomLog directive. Access log file has a highly configurable format, for example:
- LogFormat “%h %l %u %t \”%r\” %>s %b” common
- CustomLog logs/access_log common
The default location of Apache error log files and access log files is different for different operating systems.
- RHEL / Red Hat / CentOS / Fedora Linux Apache error file location: /var/log/httpd/error_log OR /var/log/httpd/access_log
- Debian / Ubuntu Linux Apache error log file location: /var/log/apache2/error.log OR /var/log/apache2/access.log
- FreeBSD Apache error log file location: /var/log/httpd-error.log OR /var/log/httpd-access.log
A log file directory created at C:\LogFiles for HTTP.sys-generated logging (W3C Extended log file format, NCSA Common log file format, IIS log file format, centralized binary logging, or HTTP.sys error logging), generates the following subdirectories as log file locations:
- For the W3C Extended, NCSA Common, and IIS log file formats: C:\LogFiles\W3SVC#, where # is the site ID
- For centralized binary logging: C:\LogFiles\W3SVC
- For HTTP.sys error logging: C:\WINDOWS\System32\LogFiles\HTTPErr
Apache log analyzers are powerful tools which helps in the analysis of error and access log files both in Common Format and Combined Log Format. Using such analyzers, server managers can obtain information about a site’s activity status, traversed paths, and accessed files as well as information about the browsers, referring pages, search engines, etc.
The program also serves as an IIS and NGINX Log Analyzer, capable of analyzing IIS log files in W3C Extended format and Apache log files in both Combined and Common formats.
NEWRELIC
Deploying log management in context and at scale has never been faster, easier, or more attainable.
- Simple to Set Up, Easy To Use
- Analyze at Scale
- Detect Patterns and Outliers in Your Log Data
- All Log Data in Context, At Your Fingertips
HUMIO

Humio’s log management enables security, ITOps & DevOps teams to stream data at scale in flexible hybrid deployment options. Log everything in real time.
- Scalable to 1PB per day
- Live observability with sub-second latency
- Fast free-text search with no indexing
- Keep 5-15x more data, for longer
- Deploy Humio in your environment in minutes
- Intuitive and easy to use
- Humio integrates with enterprise tech stacks
- Bucket storage makes all data live data
- Quotas keep things running smoothly
- Automate with alerts & web hooks
- Secure access with Role-Based Access Control (RBAC)
GOACCESS
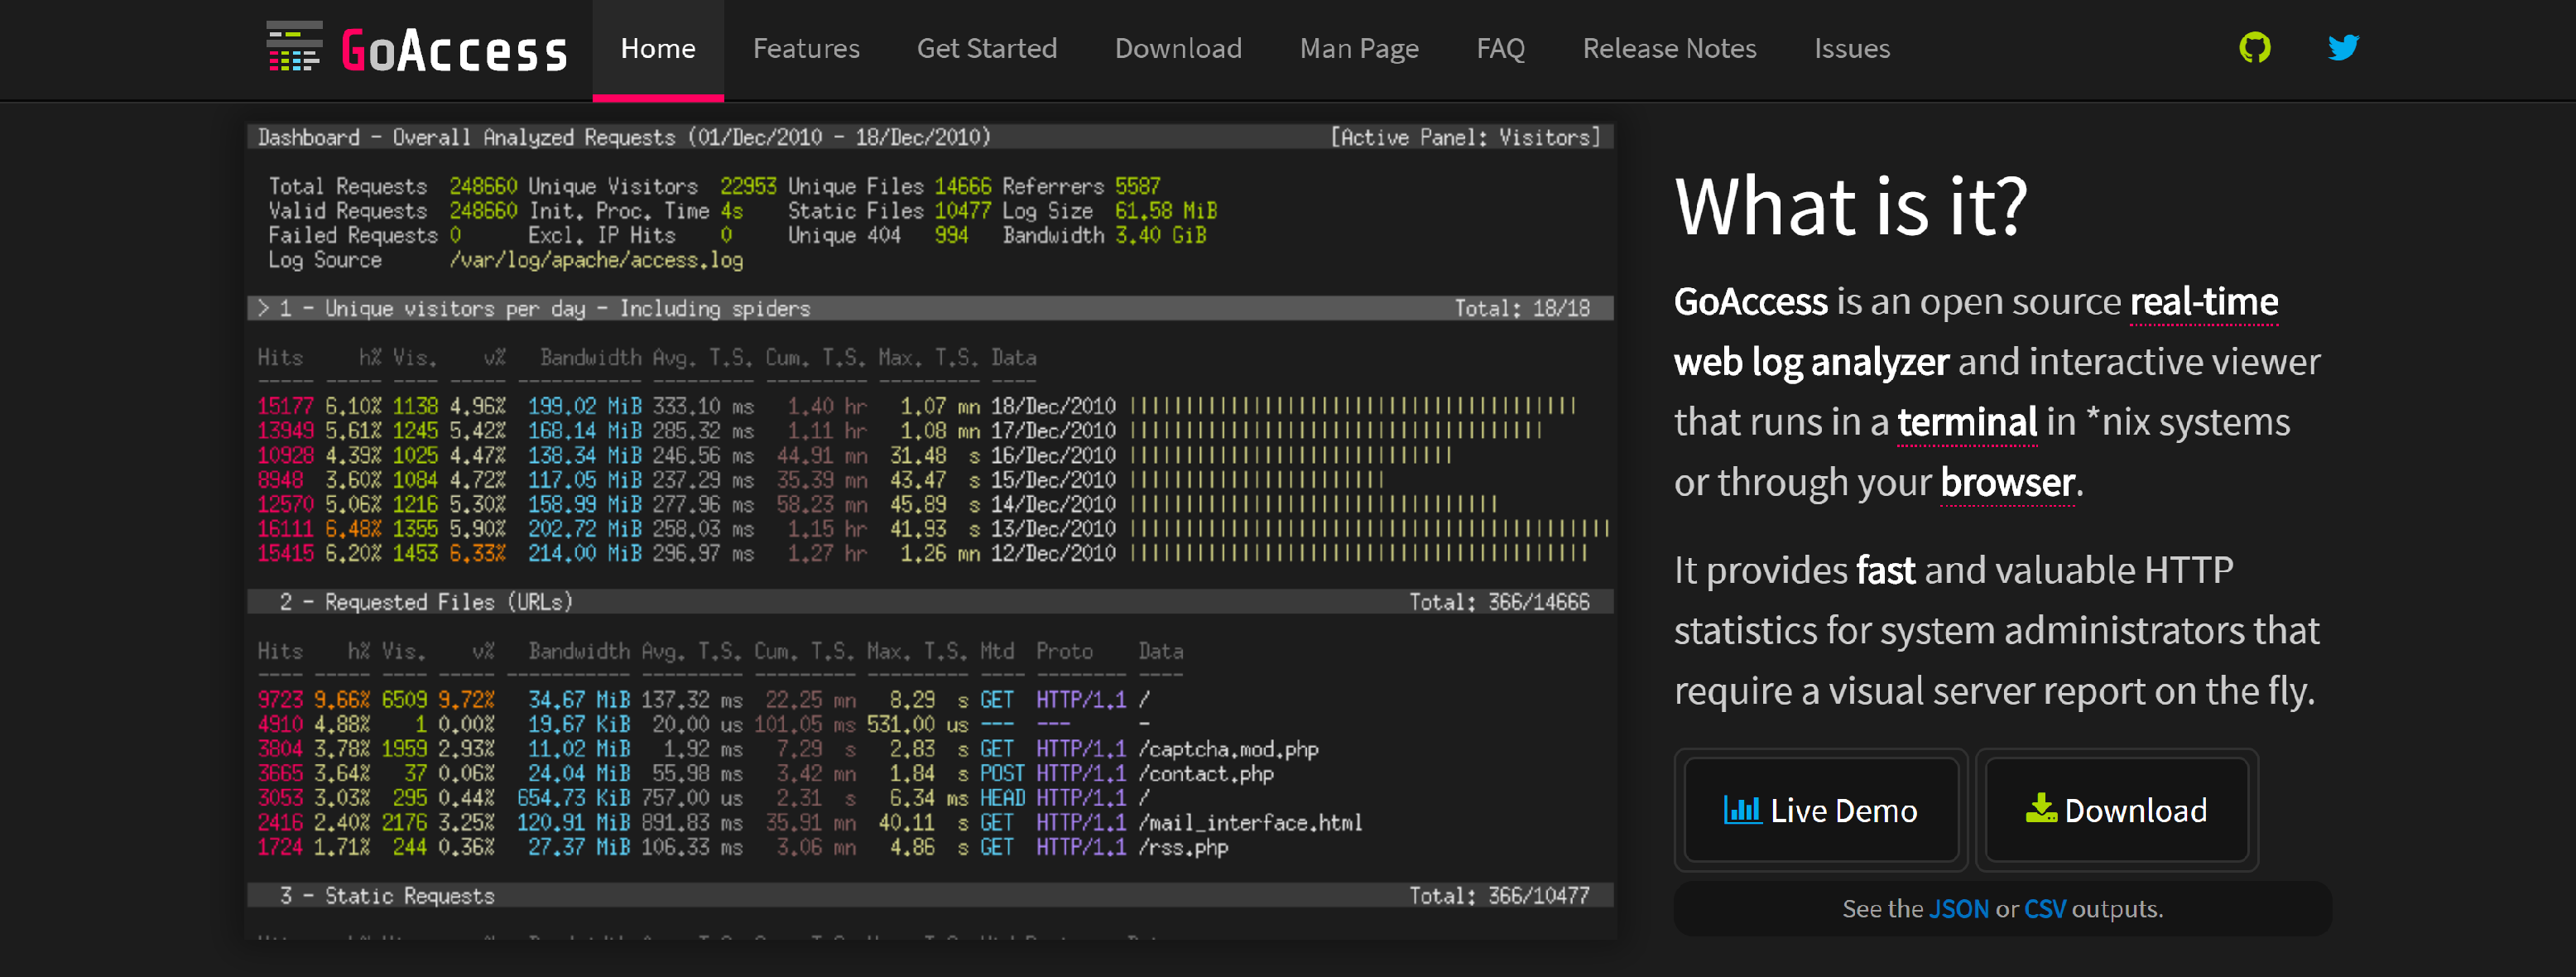
GoAccess is an open source real-time web log analyzer and interactive viewer that runs in a terminal in *nix systems or through your browser.
- Completely Real Time
- Nearly All Web Log Formats
- Track Application Response Time
- Incremental Log Processing
- Only one dependency
- Minimal configuration needed
- Visitors
- Metrics per Virtual Host
- Color Scheme Customizable
APACHEVIEWER

Apache Log Viewer (ALV) is a free tool which lets you monitor, view and analyze Apache or IIS logs with more ease.
- Supports Common/Combined/Custom and additional Apache/nginx logs.
- Supports NCSA/W3C IIS logs
- Handles multiple logs
- Supports compressed .gz logs
- Supports IPv4 & IPv6
- Split logs functionality by size/date
- Monitor logs in realtime (with automatic refresh) both local and remove via FTP/SFTP
- Highlight requests by status code
- Converts IP & IPv6 to Country
- Search by any combination of Request, Date, IP, Referrer and UserAgent
- Filter by any combination of Status/IP Address, GET, HEAD, POST Requests, Date, Referrer or User-agent
- Export to text file (txt), comma separated value (csv), log file or html
- Various Graphical Reports (Pie/Bar/Line/StackedBar)
- Various Statistics
LOGGLY
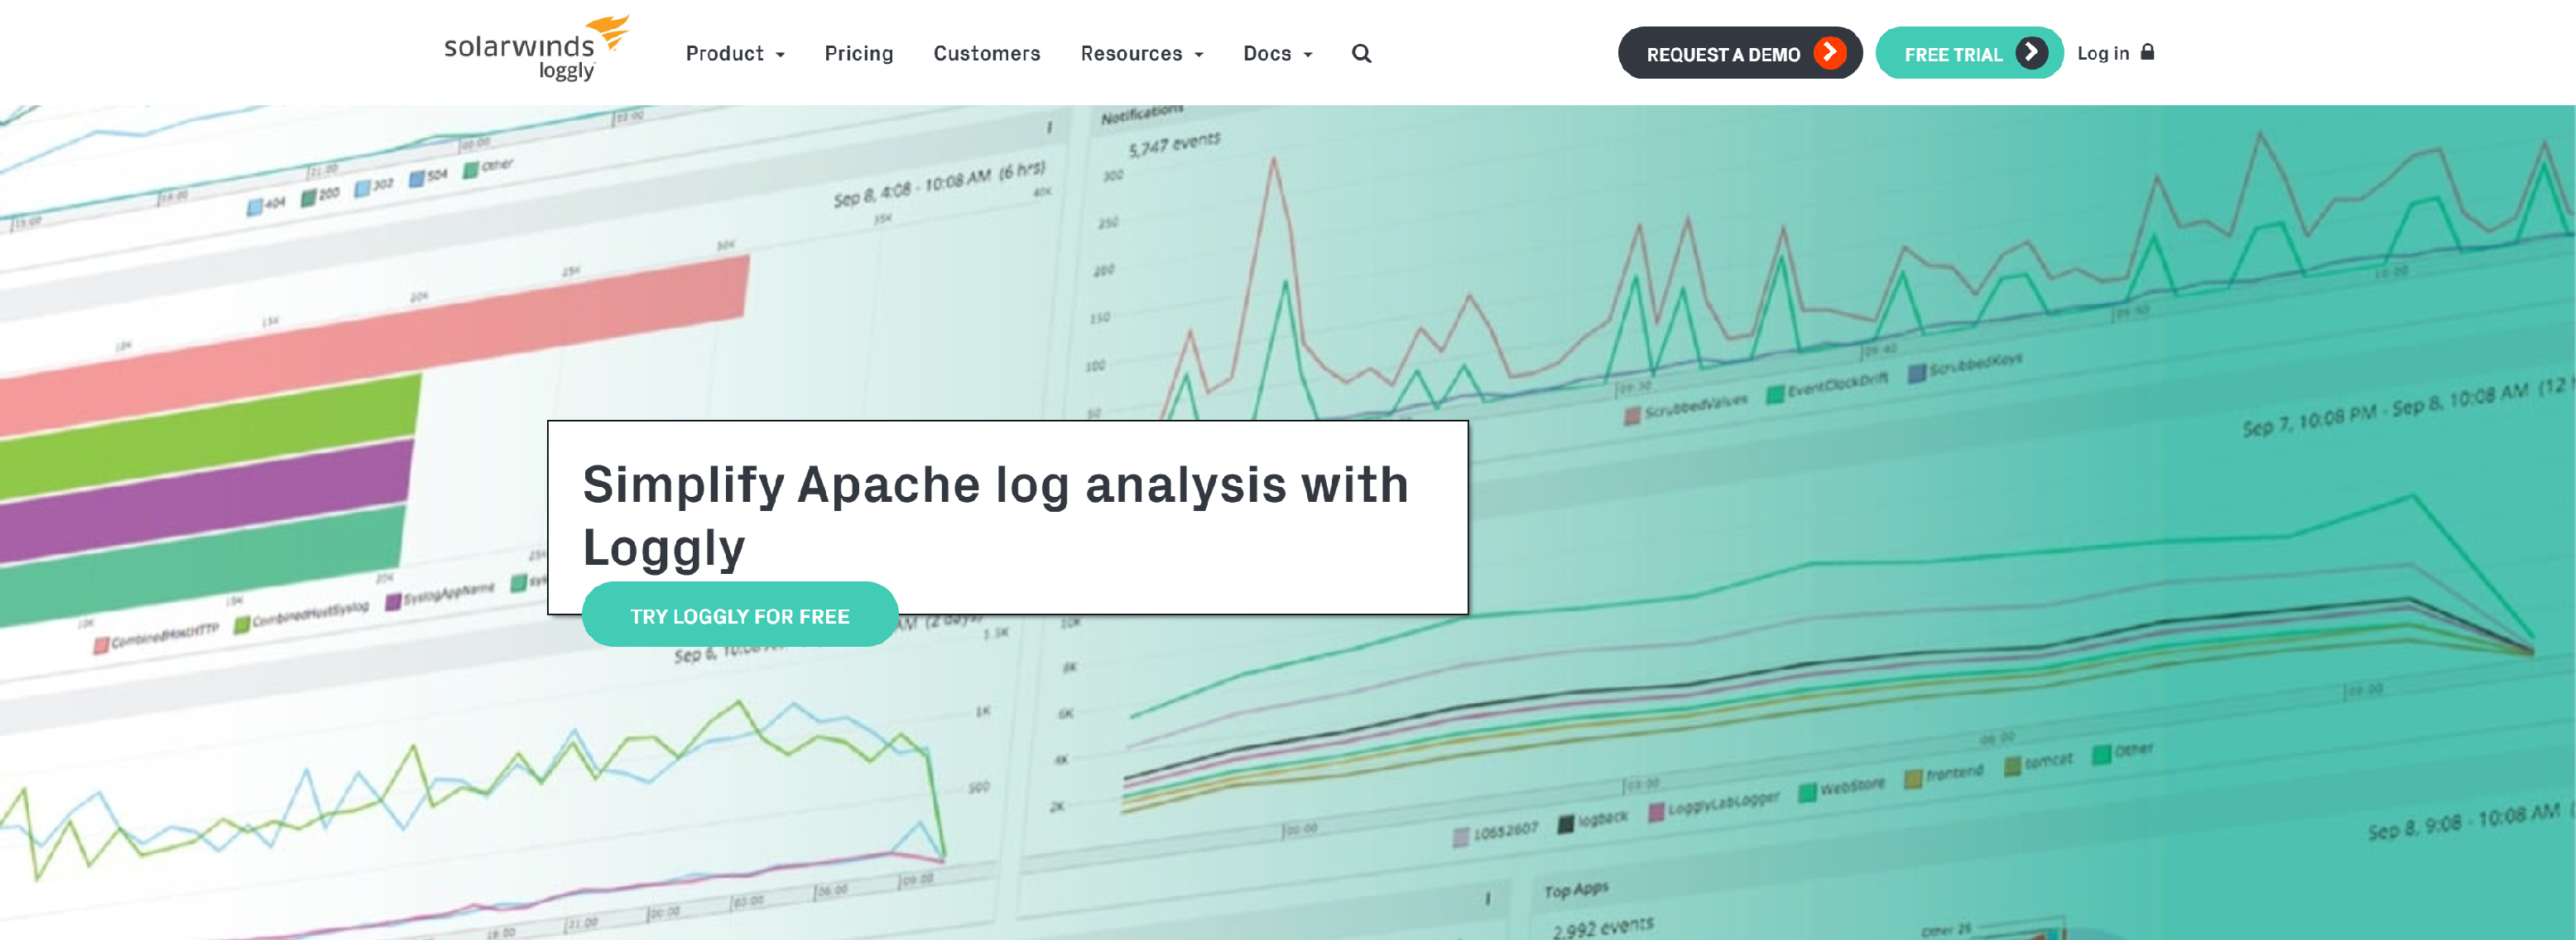
Simplify Apache log analysis with a cloud-based log management service which offers faster search, automated parsing, preconfigured dashboards, and more.
- Manage all your Apache logs with Loggly
- Get faster search and troubleshooting features
- Visualize your logs with charts and dashboards
MANAGEENGINE
EventLog Analyzer makes Apache web server monitoring simple by through web server log file analysis. The Apache log reader provides multiple predefined reports to help you analyze your Apache logs and ensure efficient management.
- Apache web server monitoring
- Apache web server management
- Apache access log auditing
- Apache web server reports
WEBLOGEXPERT
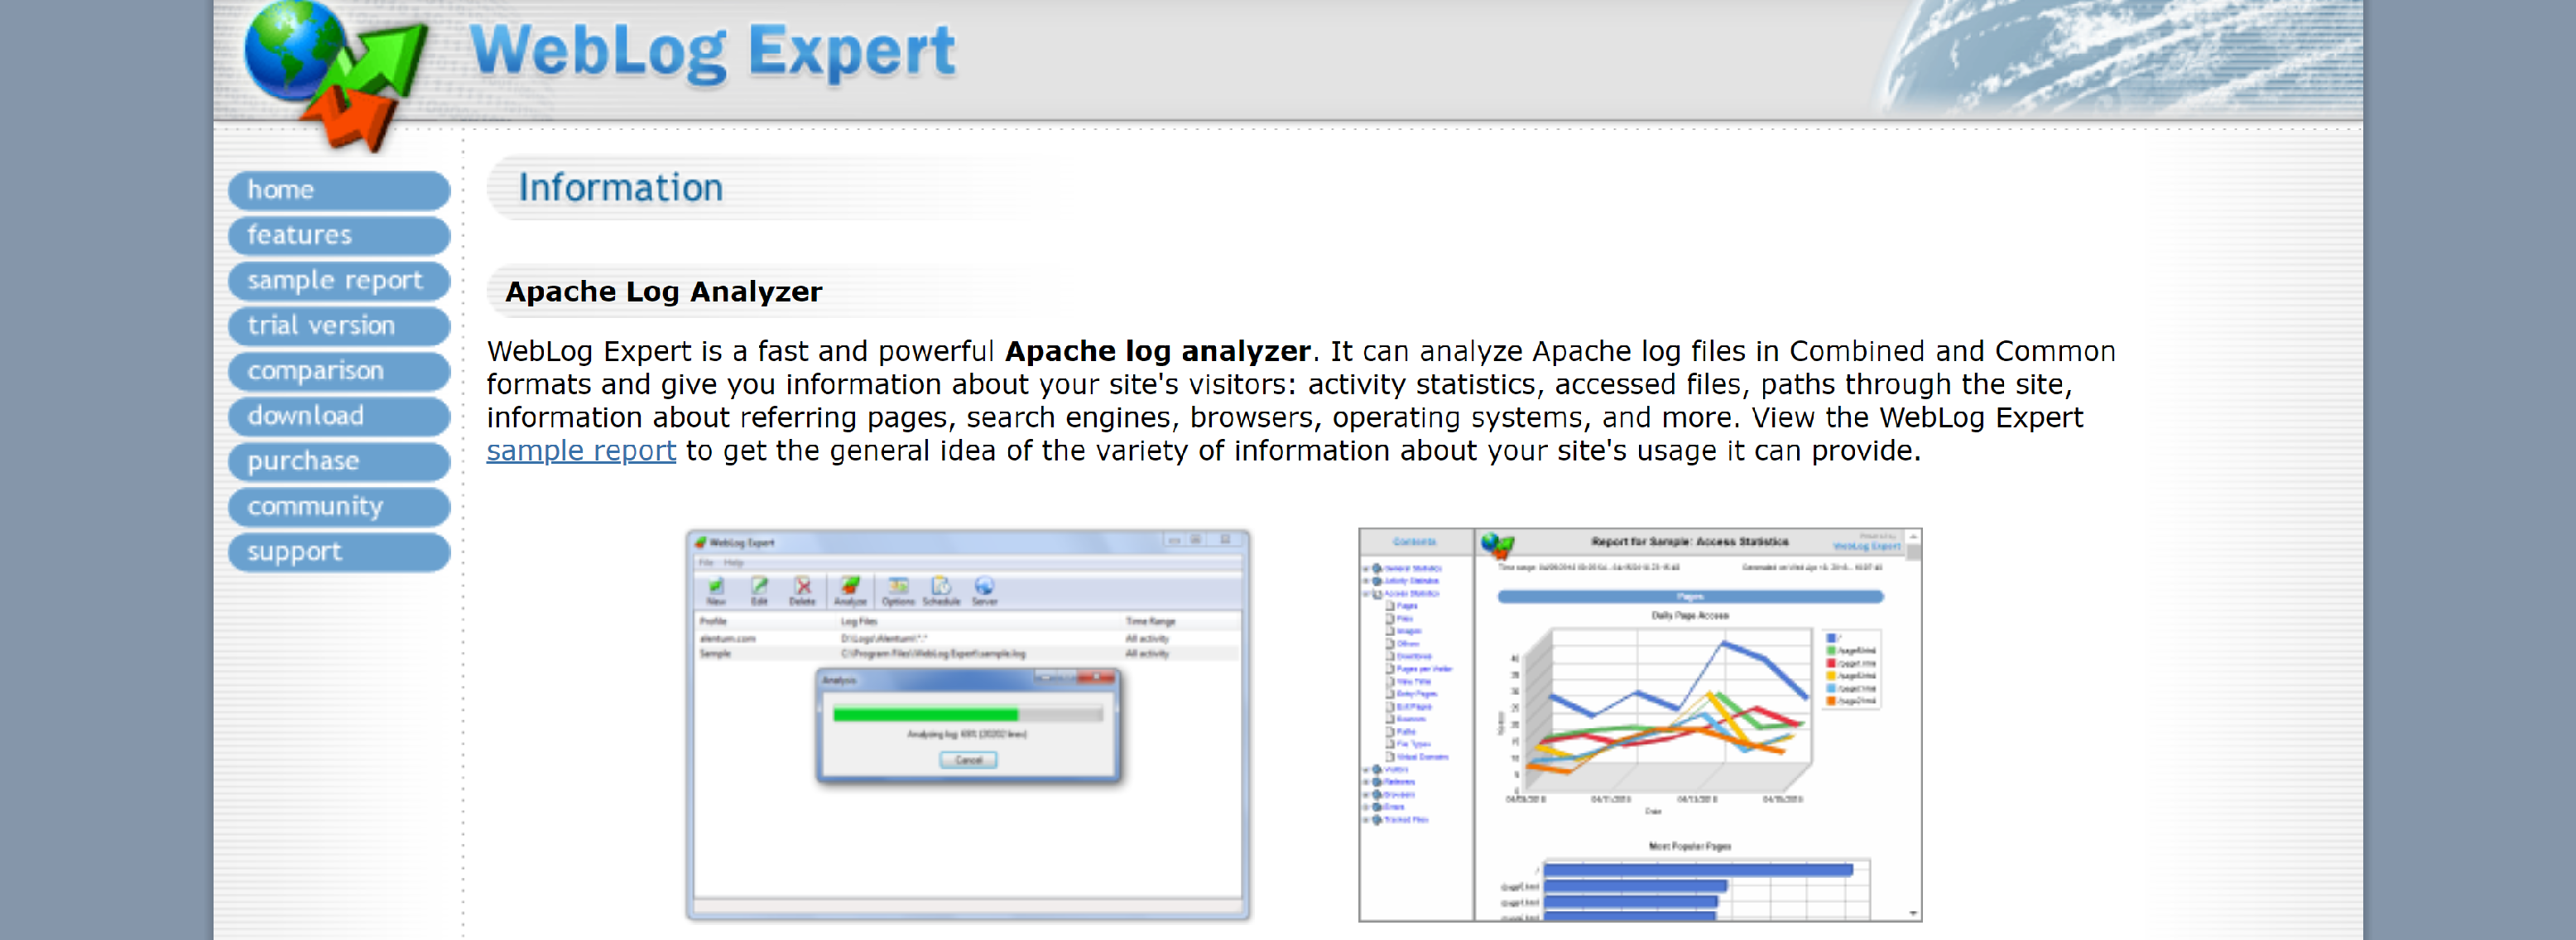
WebLog Expert is a fast and powerful Apache log analyzer. It can analyze Apache log files in Combined and Common formats and give you information about your site’s visitors: activity statistics, accessed files, paths through the site, information about referring pages, search engines, browsers, operating systems, and more.
- Works under Windows XP/2003/Vista/2008/7/8/2012/10/2016 operating system
- Supports Apache and IIS log files
- Additional log formats supported: Nginx, Amazon CloudFront/S3/ELB, Microsoft ISA/TMG
- Automatically detects most log formats, supports custom Apache log formats
- Can read GZ and ZIP compressed logs
- Can analyze logs from load balanced servers
- Can download logs via FTP and HTTP
- Log cache for downloaded log files
- And More.
SOLARWINDS
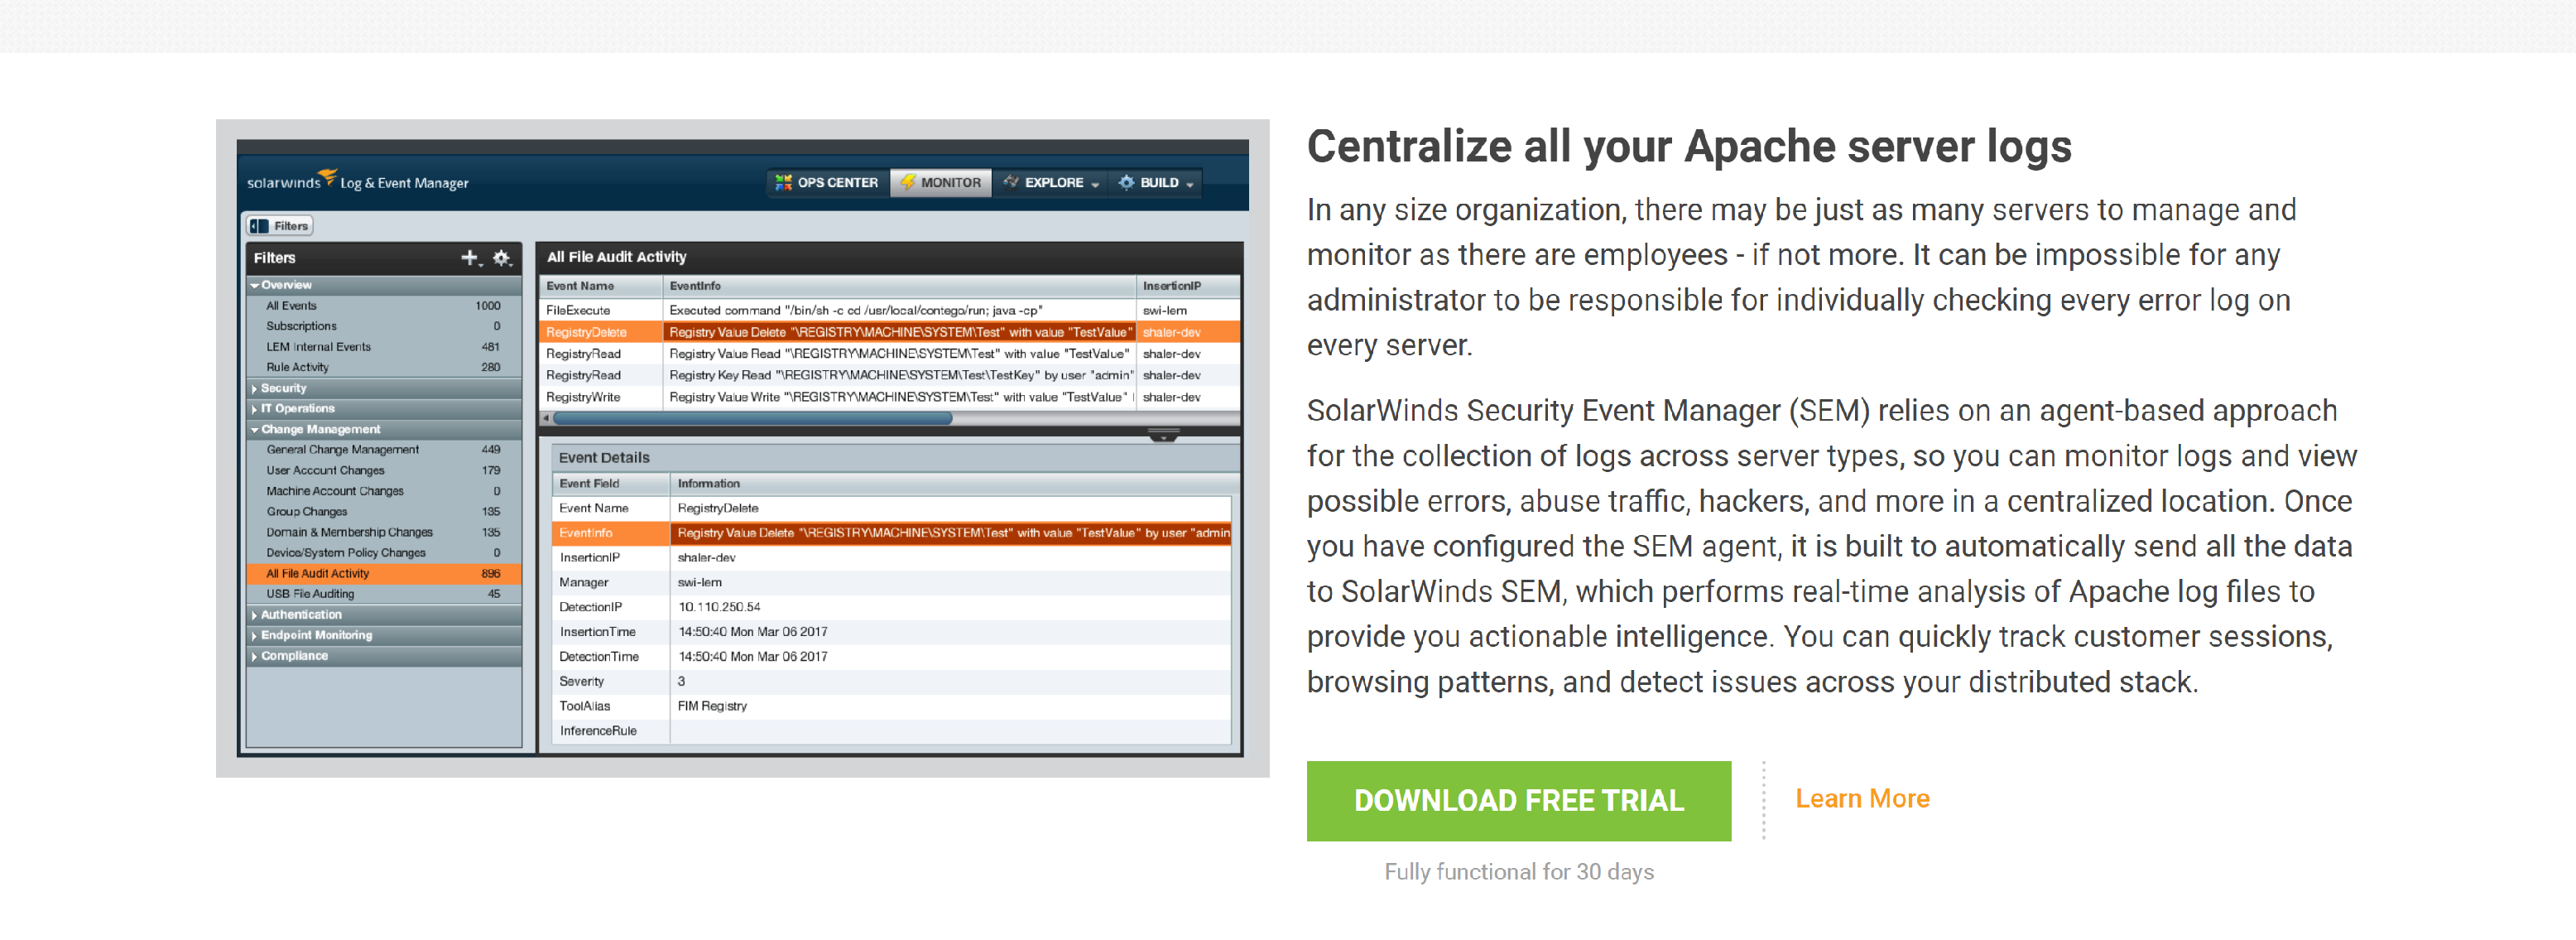
SolarWinds IT monitoring and management tools are built for SysAdmins and network engineers who need powerful and affordable tools.
- Centralize all your Apache server logs
- Monitor important Apache log fields and metrics
- Expedite troubleshooting with event-time correlation
- Improve your security posture
- Get a bird’s-eye view with advanced visualization
- Compress data for efficient storage of logs
- Streamline compliance management
- Generate graphical reports in just a few clicks
10-STRIKE

10-Strike Log-Analyzer is a web analytics software that processes raw log files (NCSA common and extended formats) from your web servers like Apache, and generates many types of reports and diagrams (see the detailed list below).
- Apply date, traffic, file, and site filters to create specific reports on your exact files
- Filter out graphic images, CSS and JS files, and analyze only important data
- Open referrer links in your web browser and visit the referring sites in a single mouse click
- Order a license and get free lifetime upgrades and priority e-mail support
NAGIOS
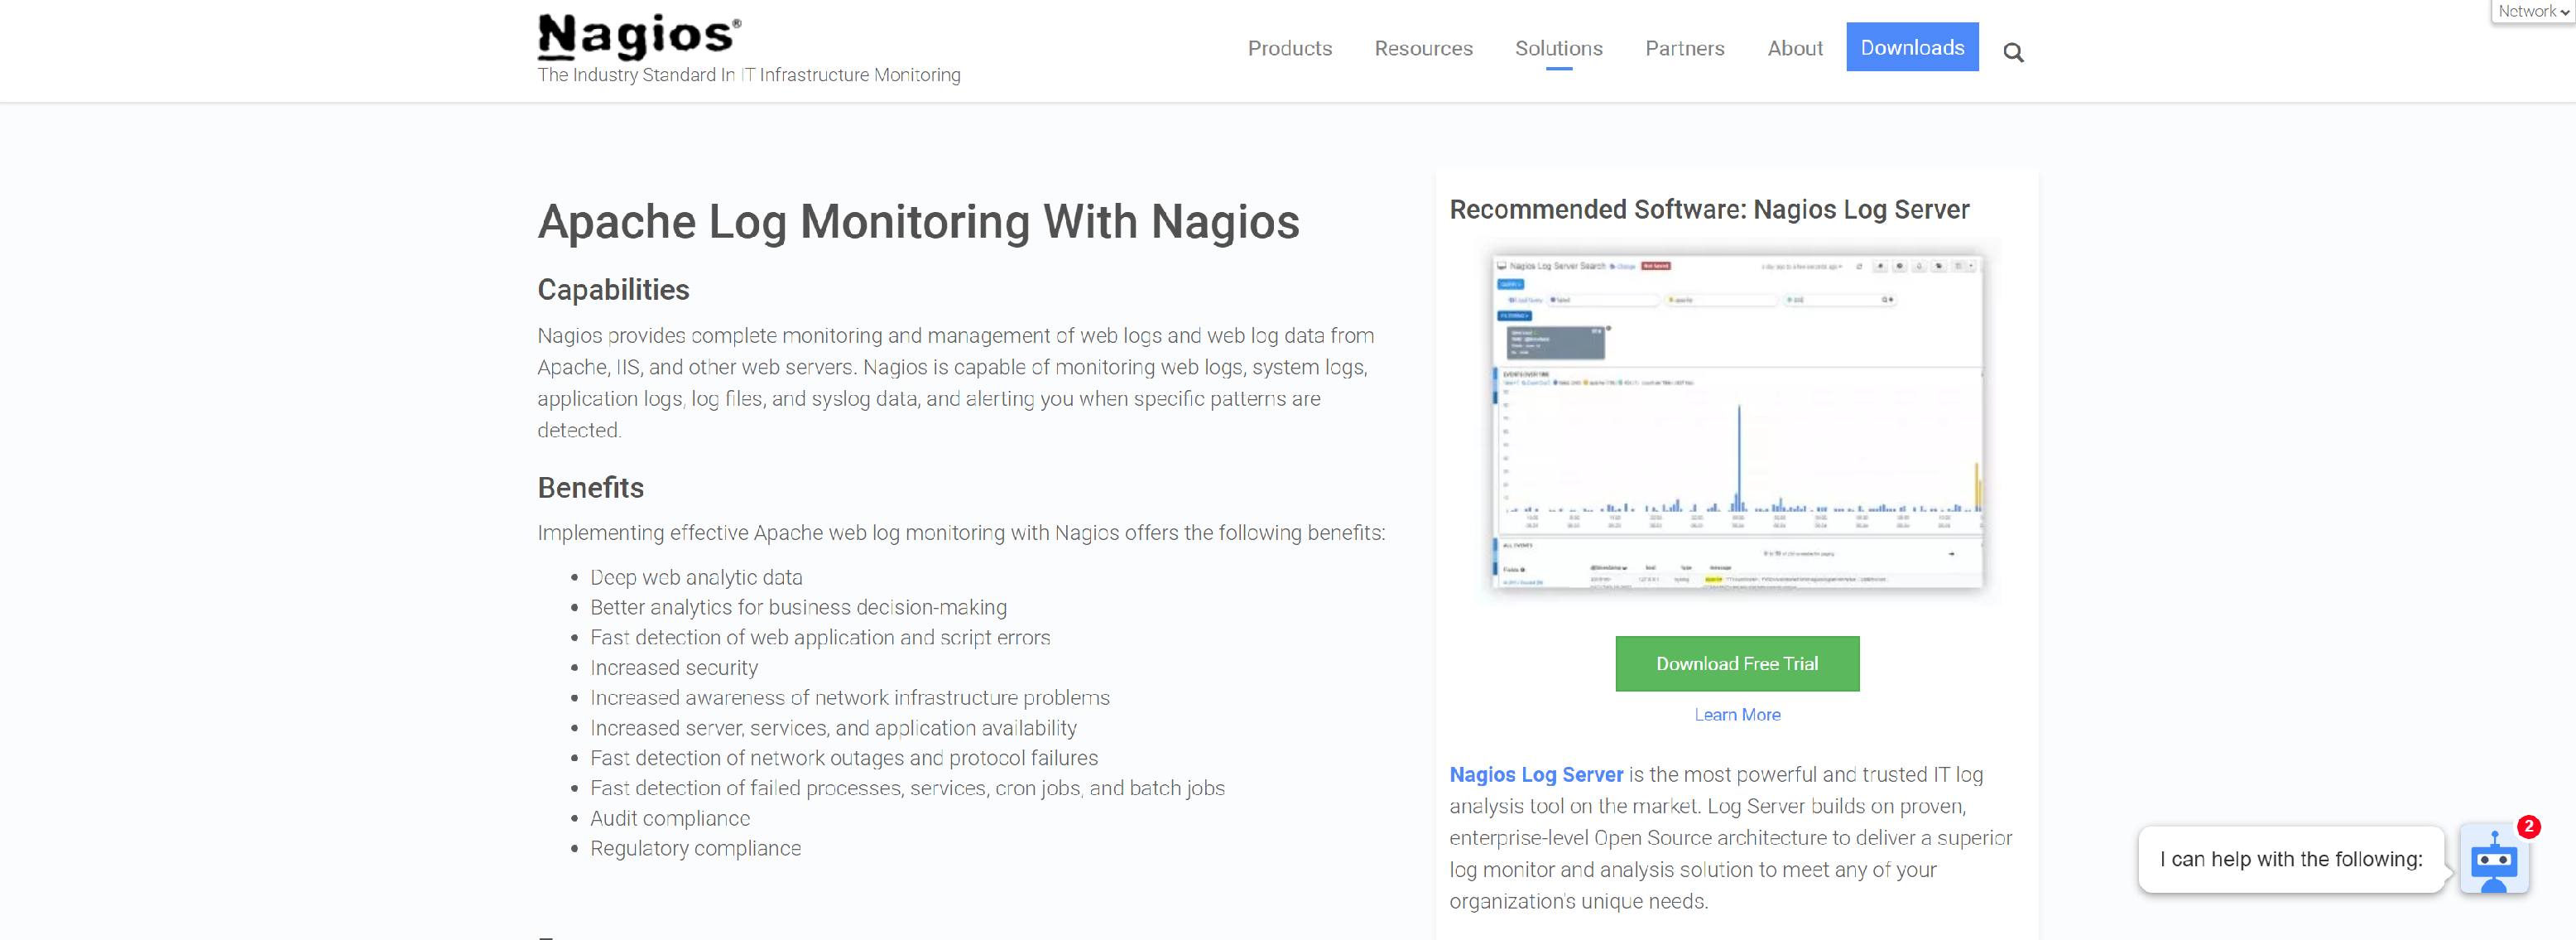
Nagios Log Server provides complete monitoring and management of web logs and web log data from Apache, IIS, and other web servers.
- Deep web analytic data
- Better analytics for business decision-making
- Fast detection of web application and script errors
- Increased security
- Increased awareness of network infrastructure problems
- Increased server, services, and application availability
- Fast detection of network outages and protocol failures
- Fast detection of failed processes, services, cron jobs, and batch jobs
- Audit compliance
- Regulatory compliance