When it comes to enterprise reporting, you have a myriad of report options to choose from including static reports, OLAP reports, dashboards, technical reports, big data and more. Ad hoc reporting is yet another option, and it is extremely beneficial.
What is Ad Hoc Reporting?
Ad hoc reports are reports generated by end users on demand. Instead of relying on standard reports or attempting to get specific data by modifying an existing report, ad hoc reporting allows users to quickly create specialized reports based on their unique criteria.
How to Create Ad Hoc Reports
How a user creates an ad hoc report varies depending on which enterprise reporting solution is being used. Due to the nature of ad hoc reporting, most business intelligence solutions offer user-friendly ad hoc reporting tools such as drag and drop modules or reusable templates. In general, the user determines which key performance indicators to include and which filters to apply.
The Benefits of Ad Hoc Reporting
Not only are ad hoc reports easy for the average user to create, they offer several important benefits including:
- Access to detailed reports as needed – Users generate reports on demand.
- A reduced reliance on IT – Ad hoc reporting is easy to use and does not require help from a report designer or IT professional.
- Ad hoc reporting saves time – Users can quickly find insights and information based on their unique requirements.
- Improved insights – Ad hoc reporting tools allow users to filter, group, organize, and chart data, providing multiple ways to visualize the information.
- Facilitates better, faster decisions – With access to relevant data on demand, users can make better decisions in a timelier manner.
Ad hoc reporting is easy to use, saves IT resources, empowers end users, and can lead to better, faster decisions. With on demand access to easy enterprise reporting tools, your team is better equipped to carry out your company’s mission.
CALUMO
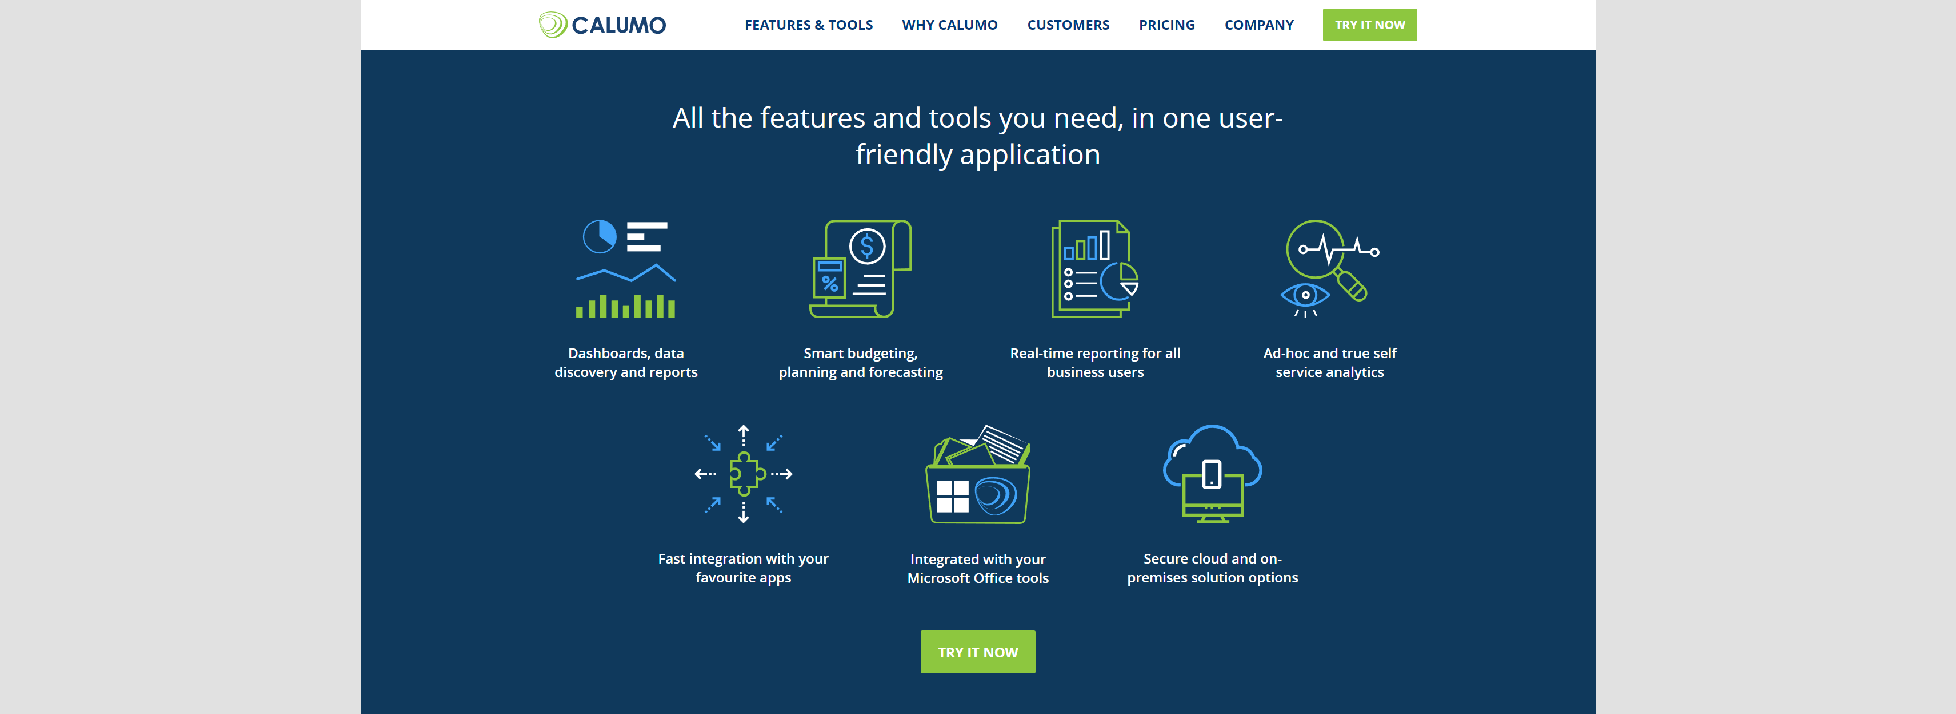
CALUMO is one of the world’s leading business intelligence and corporate performance management solutions.
Build once and use forever:
- Flexible templates to save you time
- Use in Word or PowerPoint and stay connected with Skylights
- Build one report and use it foreverAvailable any time on any deviceOn demand or scheduled updates
- Analyse and distribute reports fast
Get the whole picture:
- Track KPIs, manage risk and take action
- View on the web using any device
- Add dynamic charts, images and in-cell sparks
- Quickly access templates and reports
- Incorporate third-party data
Make the right impression at month-end:
- Set and forget your month-end reporting
- Report on any business measure
- Reports are easy to read on any device
- Distribute packs as secure webpages
- Drill-down, drill-through, drill-to any number
Drag and drop, slice and dice:
- Produce ad-hoc reports in minutes
- Enjoy greater visibility and analysis
- Build different views of your data
- View consolidated data at any level
- Publish and share your findings fast
Design your own interface:
- Help users find the reports they need
- Create dashboard report menus
- Group reports using lists and folders
- Restrict access using groups
- Simple drag and drop interface
INETSOFT
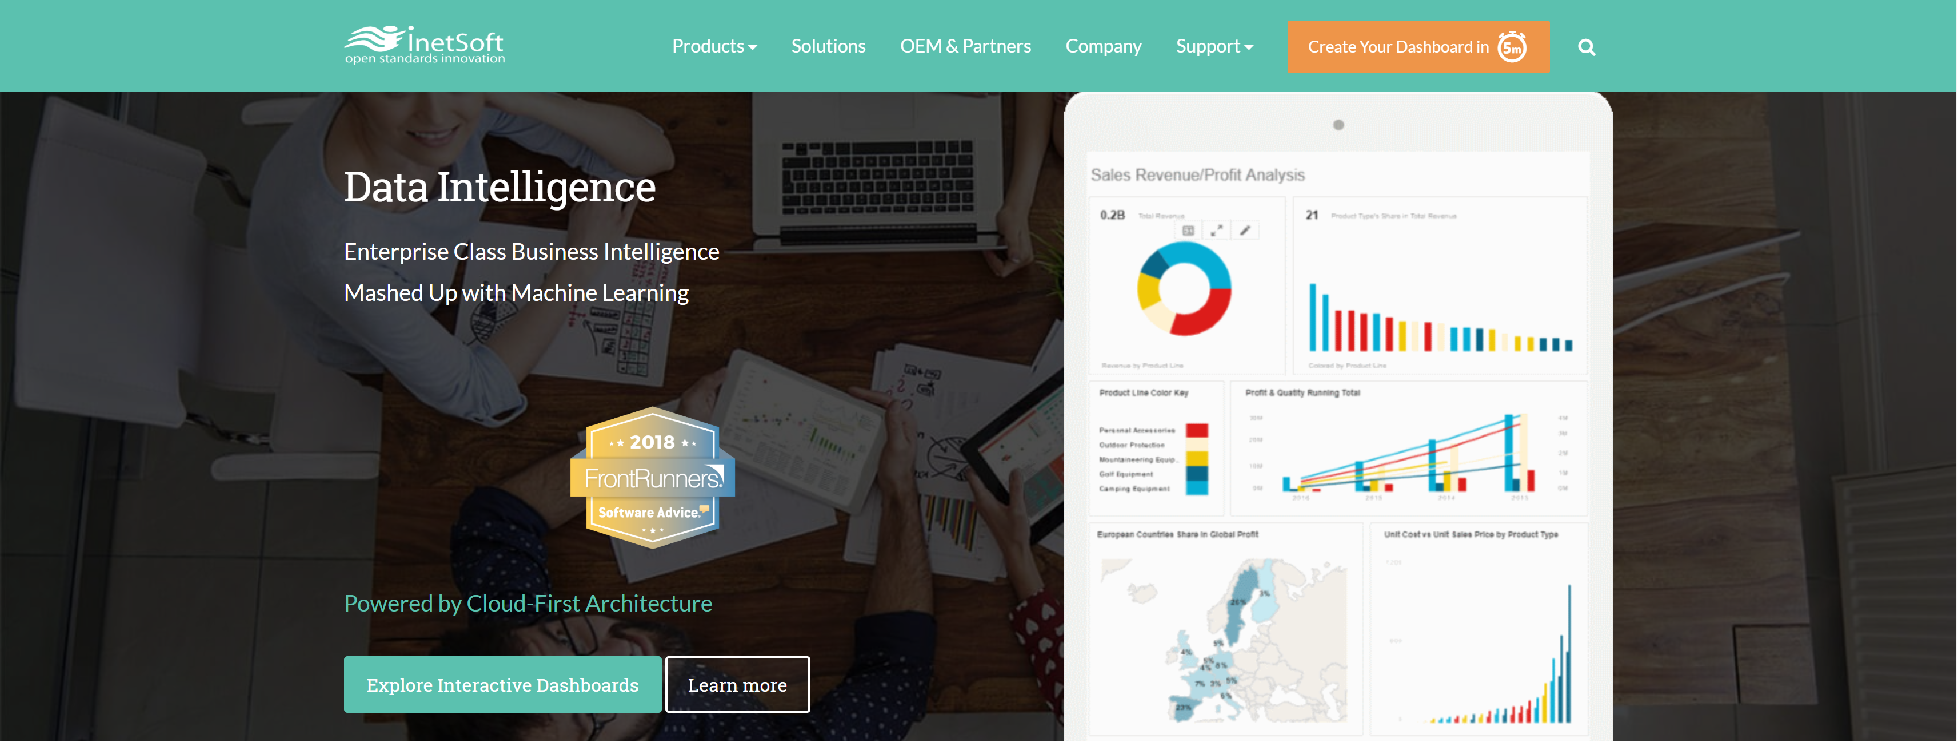
InetSoft is a pioneer in the field of data intelligence, providing big data analytics and dashboard reporting solutions.
- Data Mashup – Rapid Data Preparation
- Self-Service Data Mashup
- Visual Analytic Dashboards and Deliverable Document Reports
- Self-Service Analytics & Adhoc Reporting
- Mashup Human & Machine Intelligence
- High Performance & Acceleration
- Scalability to Big Data
EXAGOINC
Reporting is the bedrock of good BI, so we created a host of tools designed to give users of all technical backgrounds direct control over their data.
- Canned or ad hoc reports
- Quick, easy drag-and-drop reporting
- Effortless data merging
- Advanced tabulation
- Flexible filtering
- Intelligent formula creation
- Inter-report linking and drilldowns
- Charts and visualizations
- Exporting and scheduling
- Pixel-perfect templates
UBIQ
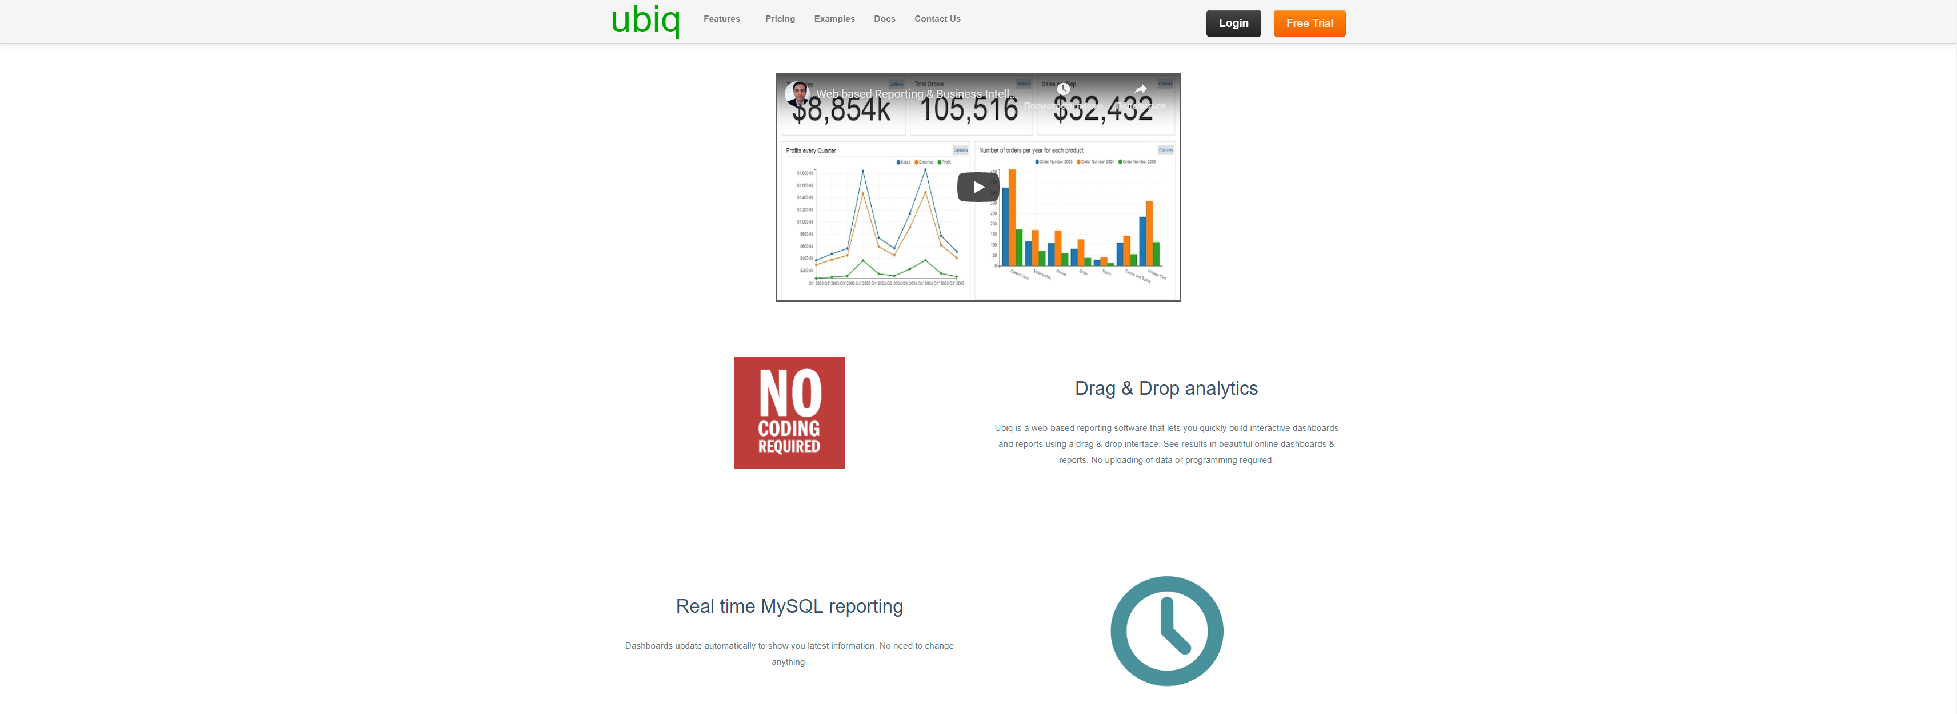
Ubiq is an application for MySQL Reporting, Dashboards, Analytics. Ubiq is a Reporting tool for MySQL reports, MySQL dashboard, Data visualizations.
- Build Ad-Hoc Reports using Drag & Drop
- Real time Ad-Hoc reporting Software
- Ad Hoc Reporting Tool for your laptop, cloud or intranet
- Ad-Hoc Reporting and Analysis for any kind of data
- Ad-Hoc Reporting Tool on the web
- Quick Setup and Easy to Use
- Secure Ad hoc Reporting Tool
DATAPINE

Datapine offers a lean Business Intelligence software that helps non-technical users to explore, visualize and share their data like never before.
- Access From Anywhere
- Quick Integration
- Automatic Reporting
- Automatic SQL Code Creation
- Intuitive
QUERYTREEAPP

QueryTree makes it easy to build and share reports on your software’s databases.
- No technical skills required
- Visualize
- Export
- Connect securely, invite teammates, and schedule reports
- QueryTree’s look and feel can be customized easily
- All the source code and documentation can be found on GitHub
- Deploy with confidence thanks to our commerical support packages