The sales industry is continually looking for new ways to improve the sales process in terms of efficiency, ease of use increasing sales revenue. The industry is extremely competitive and companies are always looking for new productivity tools that give them the edge over their competitors. Whenever the latest innovative sales tool hits the market, companies are eager to test it to see if it can help streamline the sales process and increase revenues. Nobody wants to be left behind in regard to tools that can help them master the industry. Having the best software can sometimes mean the difference between a company flourishing or barely staying afloat in the industry.
A dashboard is a visually-oriented information management system. A well-designed and intuitive sales dashboard is one of the most innovative, convenient and useful tools that a salesman can have. A professional sales dashboard is a tool that can combine many different valuable pieces of sales information and organize them into easily read sections. Before the implementation and evolution of sales dashboards, a salesperson would have had to find these pieces of information in many different locations separately. This was both inefficient and frustrating for both salespeople and management.
Sales Dashboard Design
There is a great deal of planning and design that goes into producing a high quality sales dashboard. Ideally they are designed to be an attractive, informative and efficient way to access information quickly and centrally. Similar to a car’s dashboard, a digital sales dashboard usually provides a heads-up display of the most relevant pieces of information and most have the functionality for the user to drill down for more detailed information if necessary.
The ability to update the information being shown in real-time is a very important piece of functionality that is vastly improving the usefulness of the sales dashboard. The sales industry is very fast-paced and having to wait hours or even days for access to important information is inefficient, limiting and is a competitive disadvantage that can be avoided.
A sales dashboard can be customized based on who is accessing it. For example a management dashboard can be customized to allow managers to see what salespeople are accomplishing in relation to expectations and can show areas where training opportunities exist. Salespeople can see up-to-date sales reports, lead information, and in some cases even update information in real-time. Some of the benefits this provides are:
- Reductions in time wasted looking for important information
- Management and salespeople having access the most accurate information possible with real-time updates
- Sales trends can be identified and easily mapped
- Access to the information on many different platforms
Implementing a quality, well designed sales dashboard helps to allow the sales force to focus more on the revenue generating portions of their duties by making their jobs more efficient and easier. Minimizing of administrative obstacles is realized by putting common tasks in a central location.
The ability to access the sales dashboard on different platforms such as smartphones or tablets increases productivity and allows salespeople to be well prepared without being in the office. As the technologies develop and the platforms are adopted, the sales dashboard is becoming indispensable to successful sales companies.
EDRAWSOFT
Creating flow chart, mind map, org charts, network diagrams and floor plans with rich gallery of examples and templates.
- Microsoft program alike interface that is easy to use
- Coming with extensive chart and graph templates, including bar chart, column chart, pie chart, doughnut chart, gauges chart, line chart, etc
- Many charts have smart behaviors, which greatly simplify your work. For example, by using the floating action button on the column chart, you can one click add a category, set max value, set series number, set tick number, etc
- It supports data import. By saving the sales data in a file following a certain format, and importing the file to the software, you can generate a chart (pie, column, bar, scatter, gauges, spider, line, area) instantly
- A set of nice looking themes with advanced effects make it easy to change the whole diagram theme
- It’s easy to add photos, images and edit text fields
- Enhanced export features include BMP, JPEG, EMF, WMF, PDF, SVG, HTML, Word, PowerPoint and much more format
KLIPFOLIO
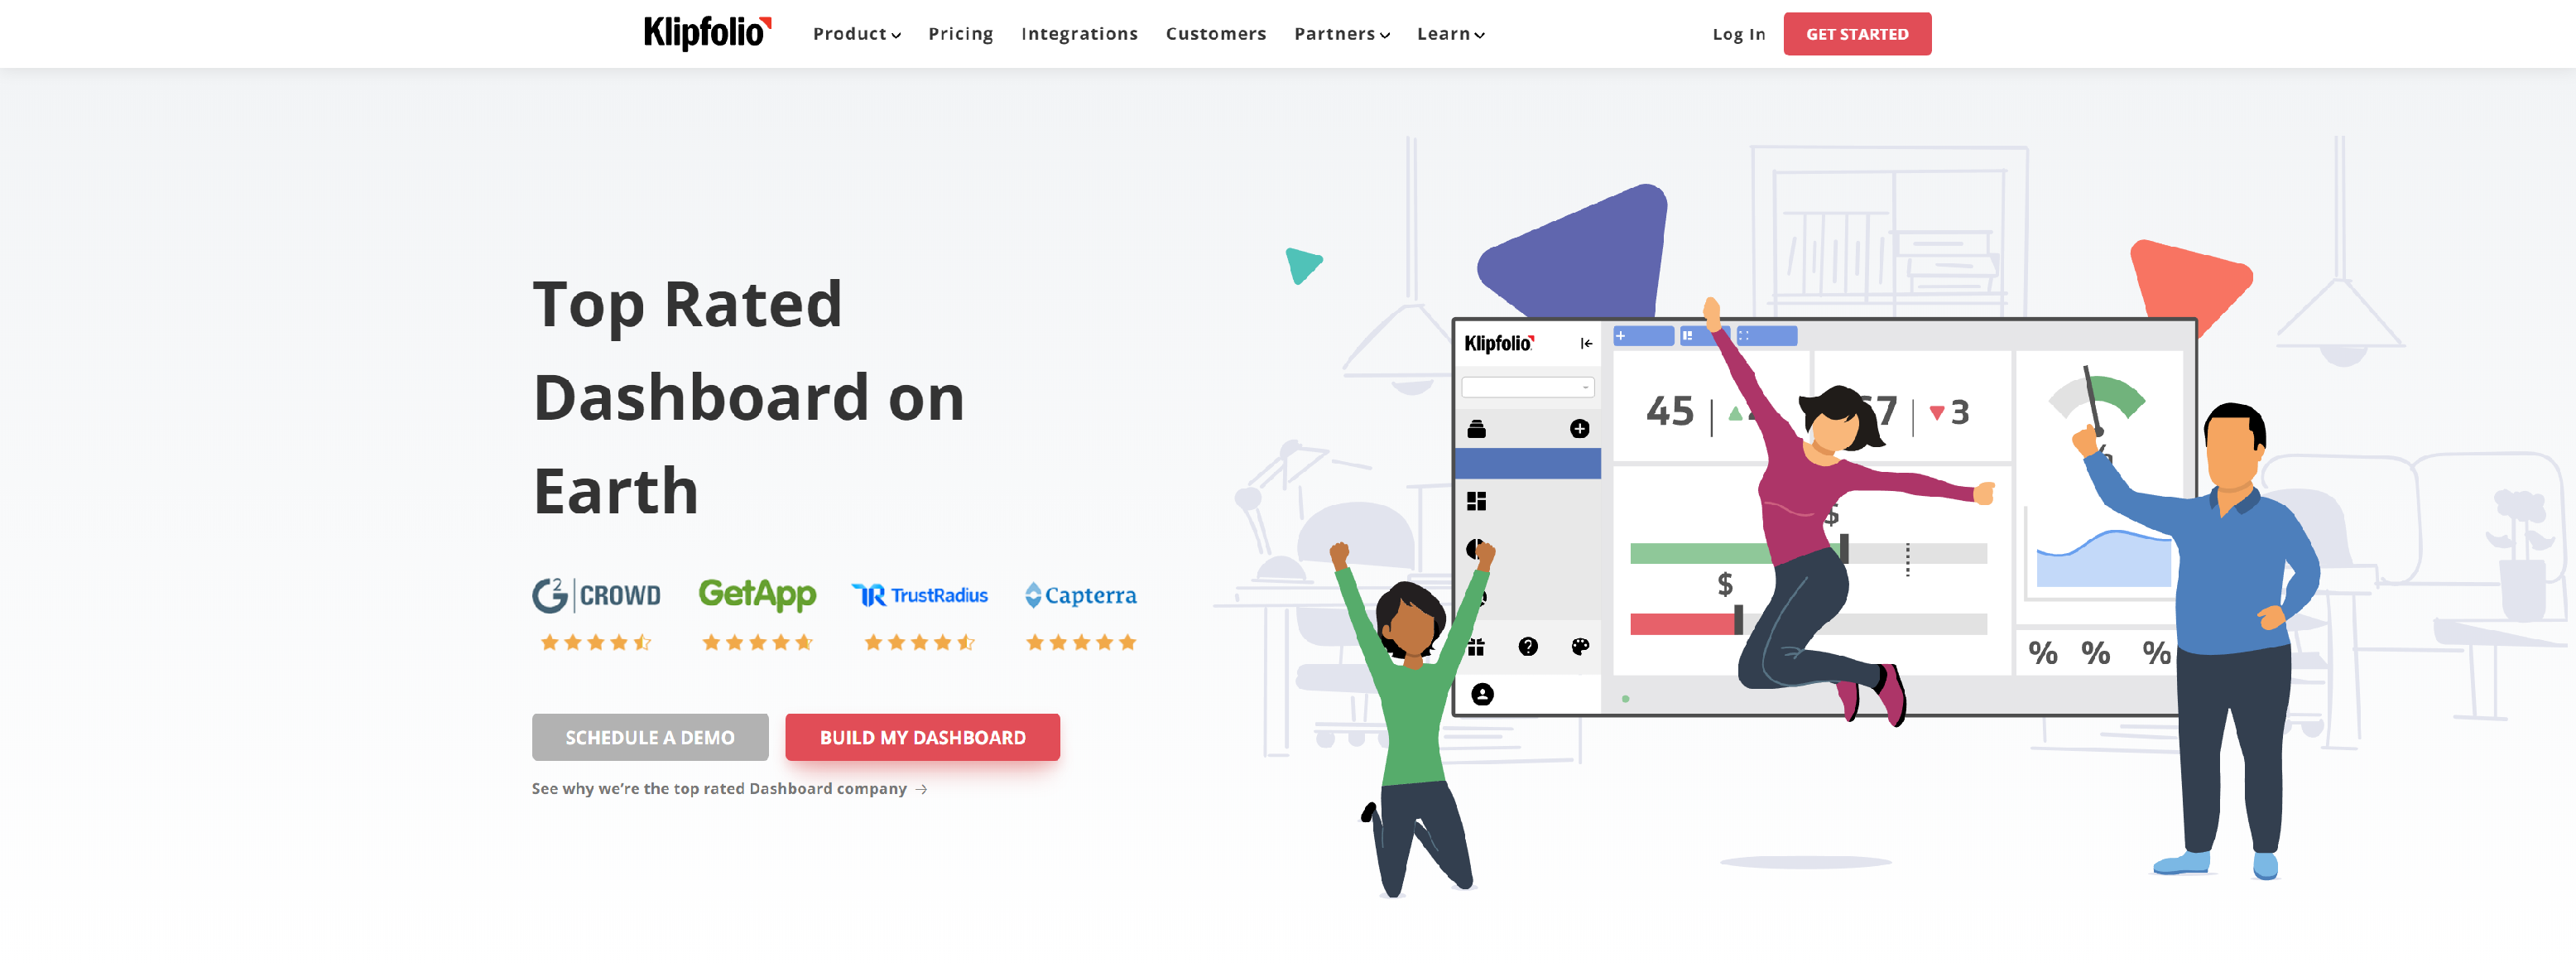
Klipfolio is an online dashboard platform for building powerful real-time business dashboards for your team or your clients.
- Work with everything
- Visual analytics at your fingertips
- Custom data visualizations
- Applied actions
- Sophisticated formulas
SCORO
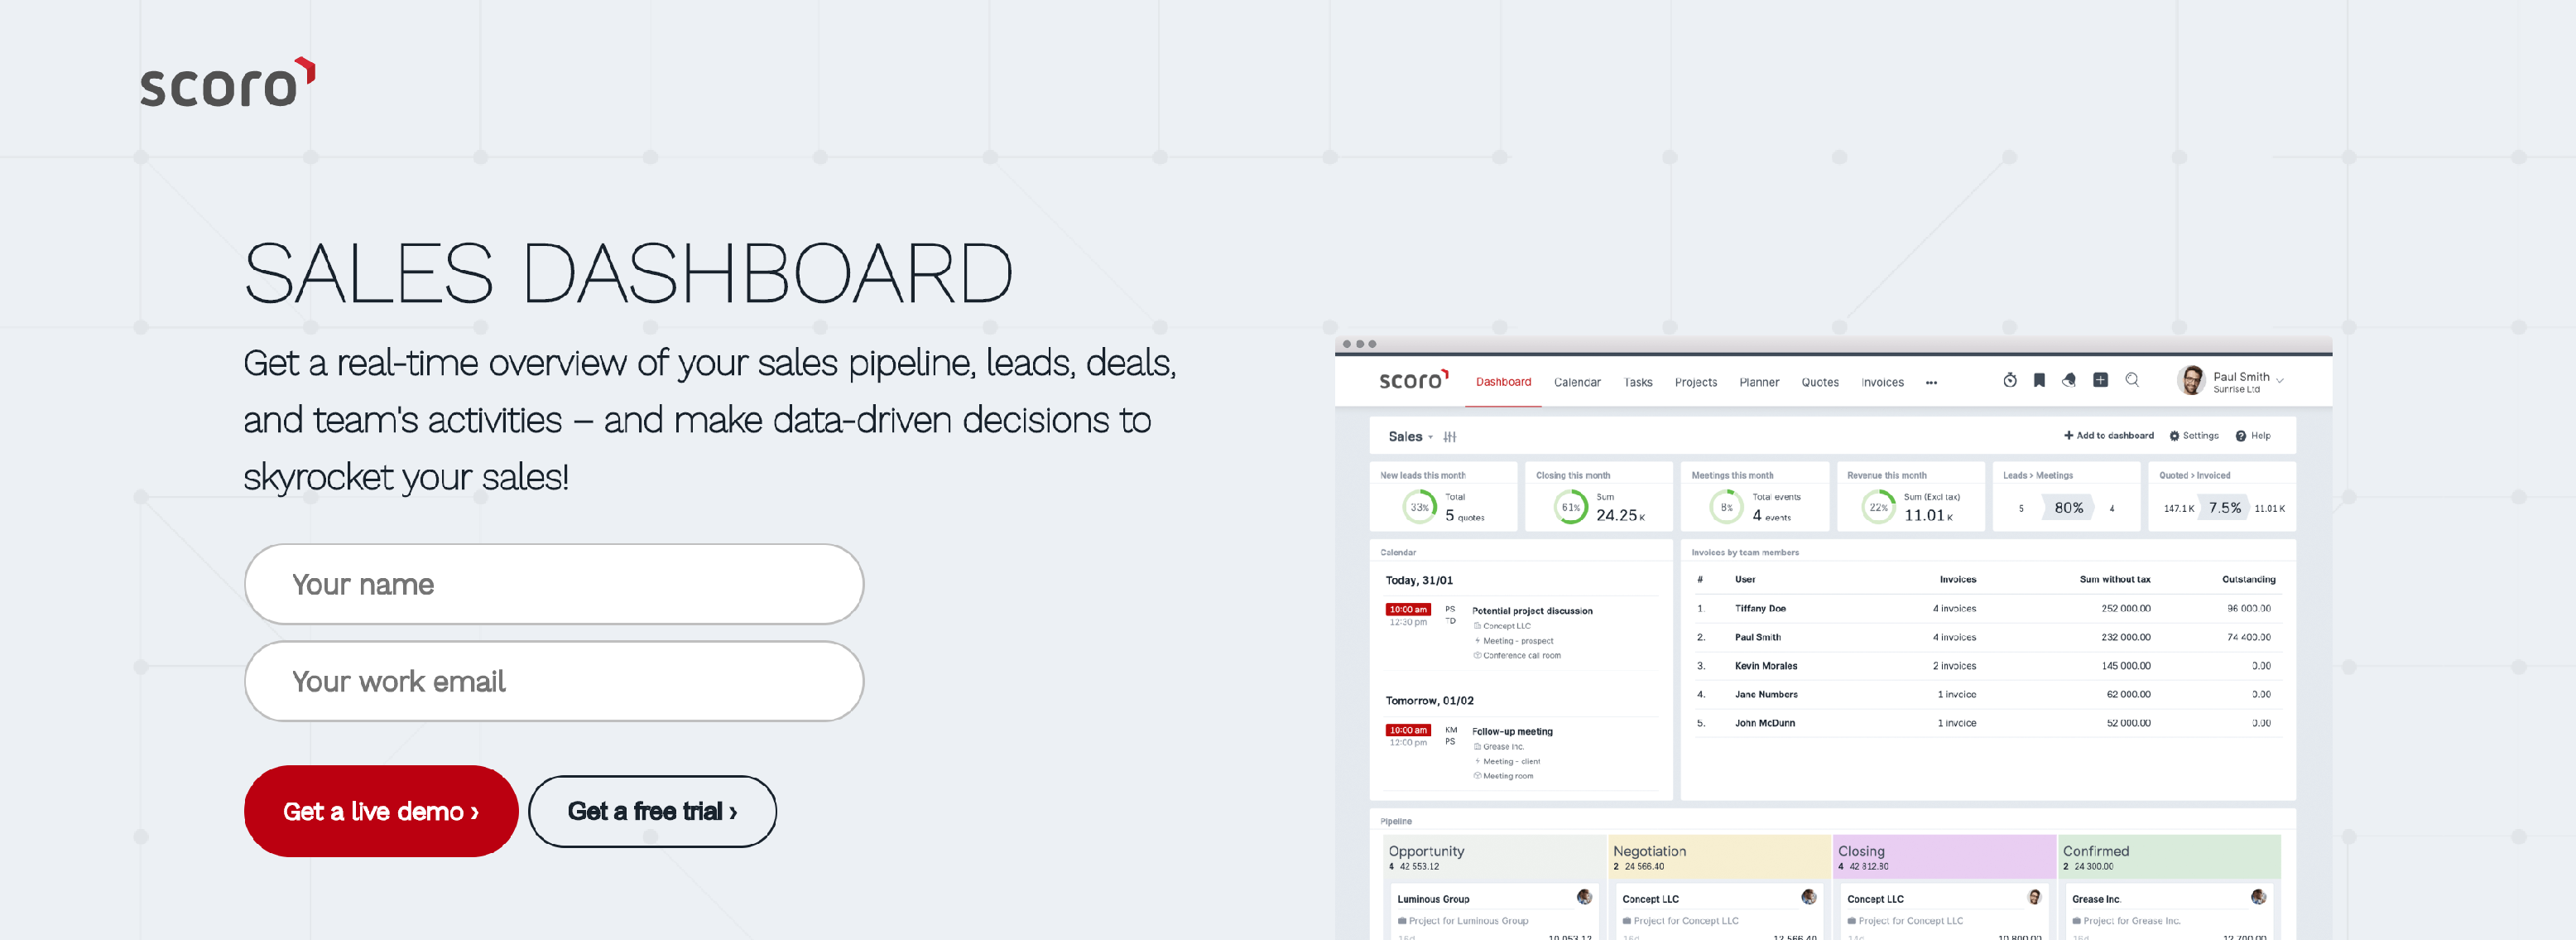
Scoro is an end-to-end business management software solution for professional and creative services that helps to streamline work and eliminate routine tasks.
- Real-time data
- Advanced CRM
- Entire business in one system
GECKOBOARD
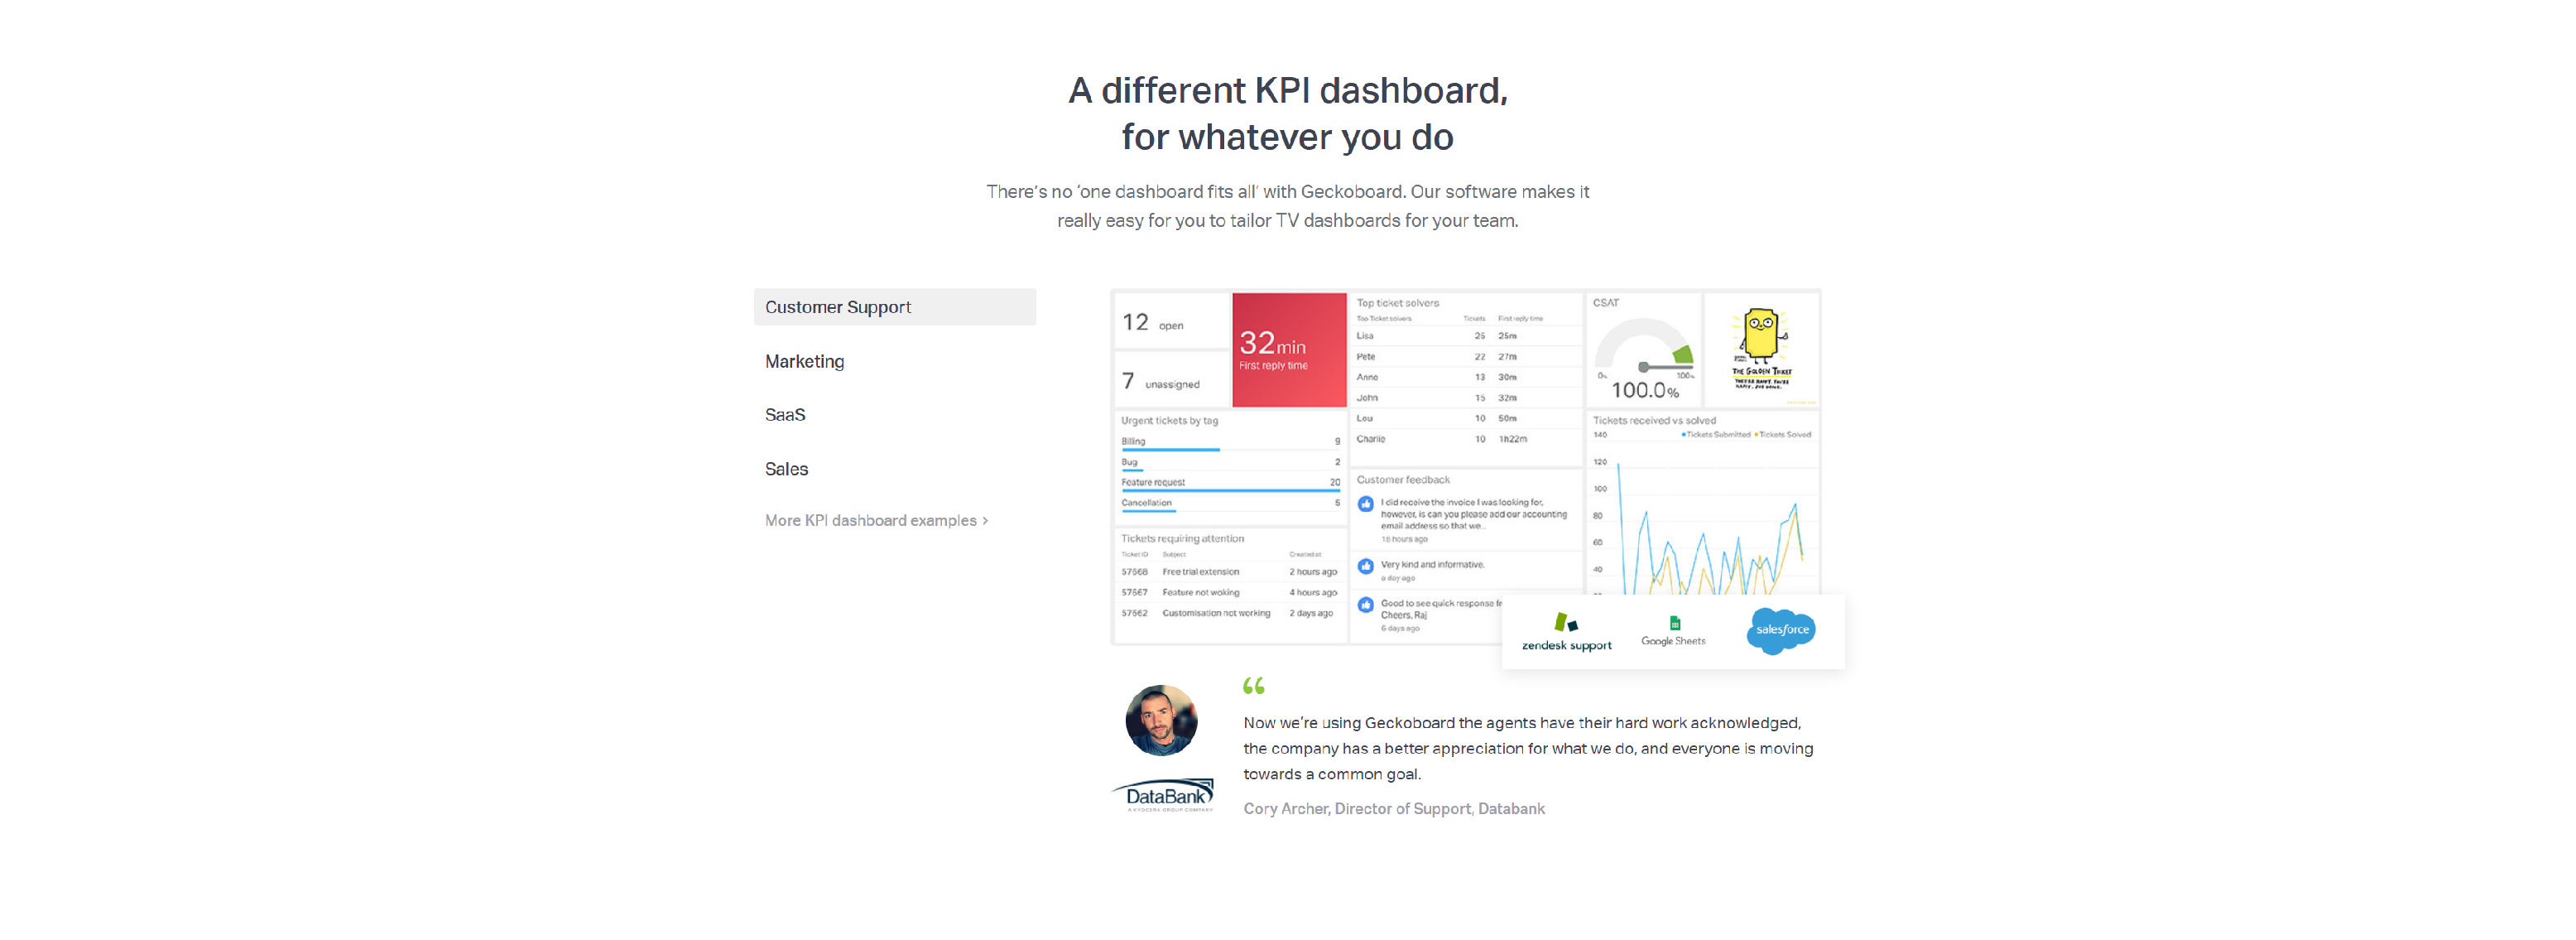
Geckoboard to build clear, effective data dashboards for your business that keep teams informed, motivated and aligned around your KPIs.
- Give it everything
- Close deals faster
- Boost revenue
UBIQ
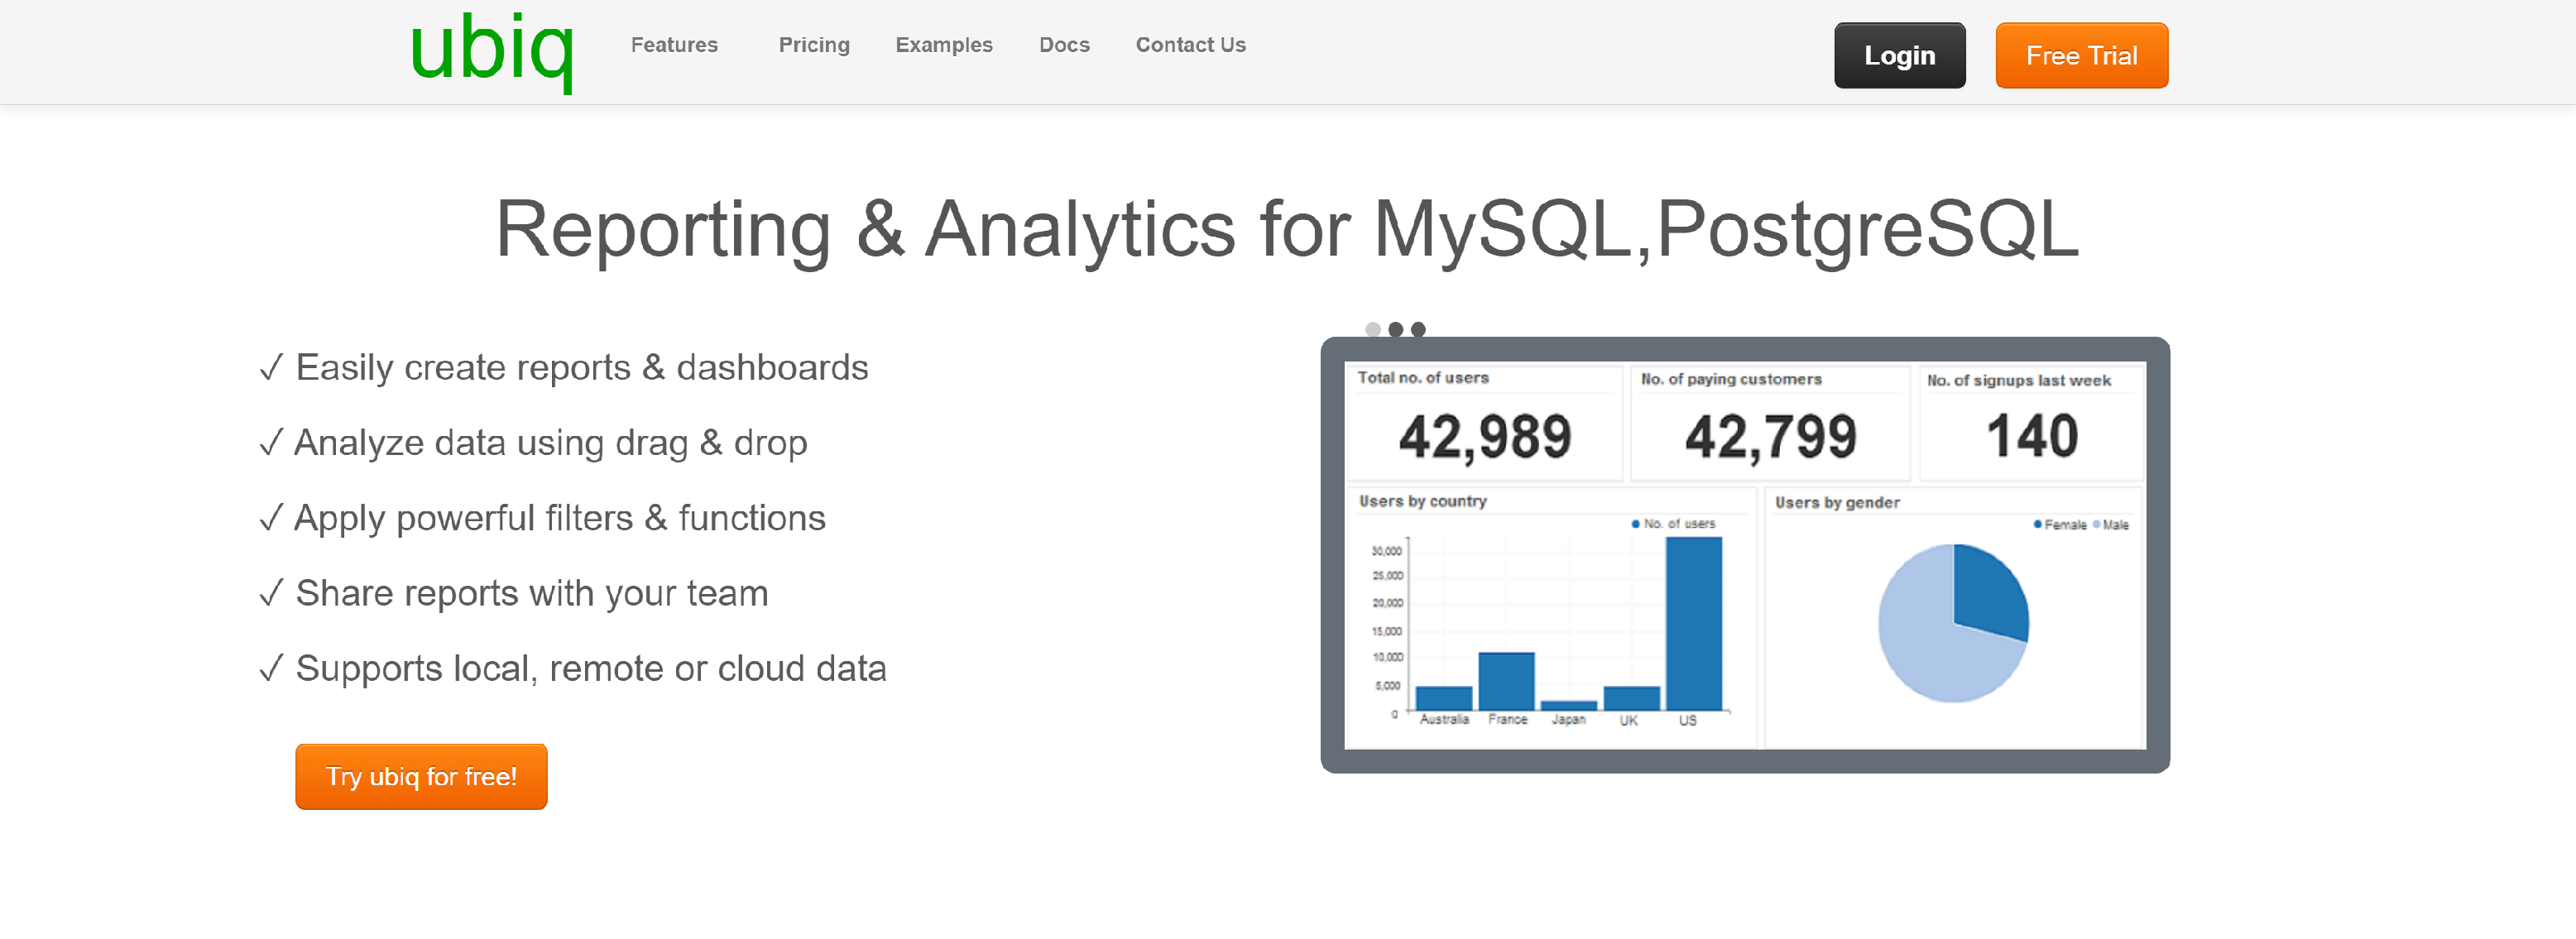
Ubiq is a sales dashboard software to quickly build custom dashboards to monitor sales team performance and gain insights.
- Quickly build sales dashboards
- Monitor sales performance in real-time
- Track Sales KPIs directly from web browser
- Build sales dashboards for any kind of business
- Access sales dashboards using web browser
- Easy to setup and easy to use
- Secure to use
INETSOFT
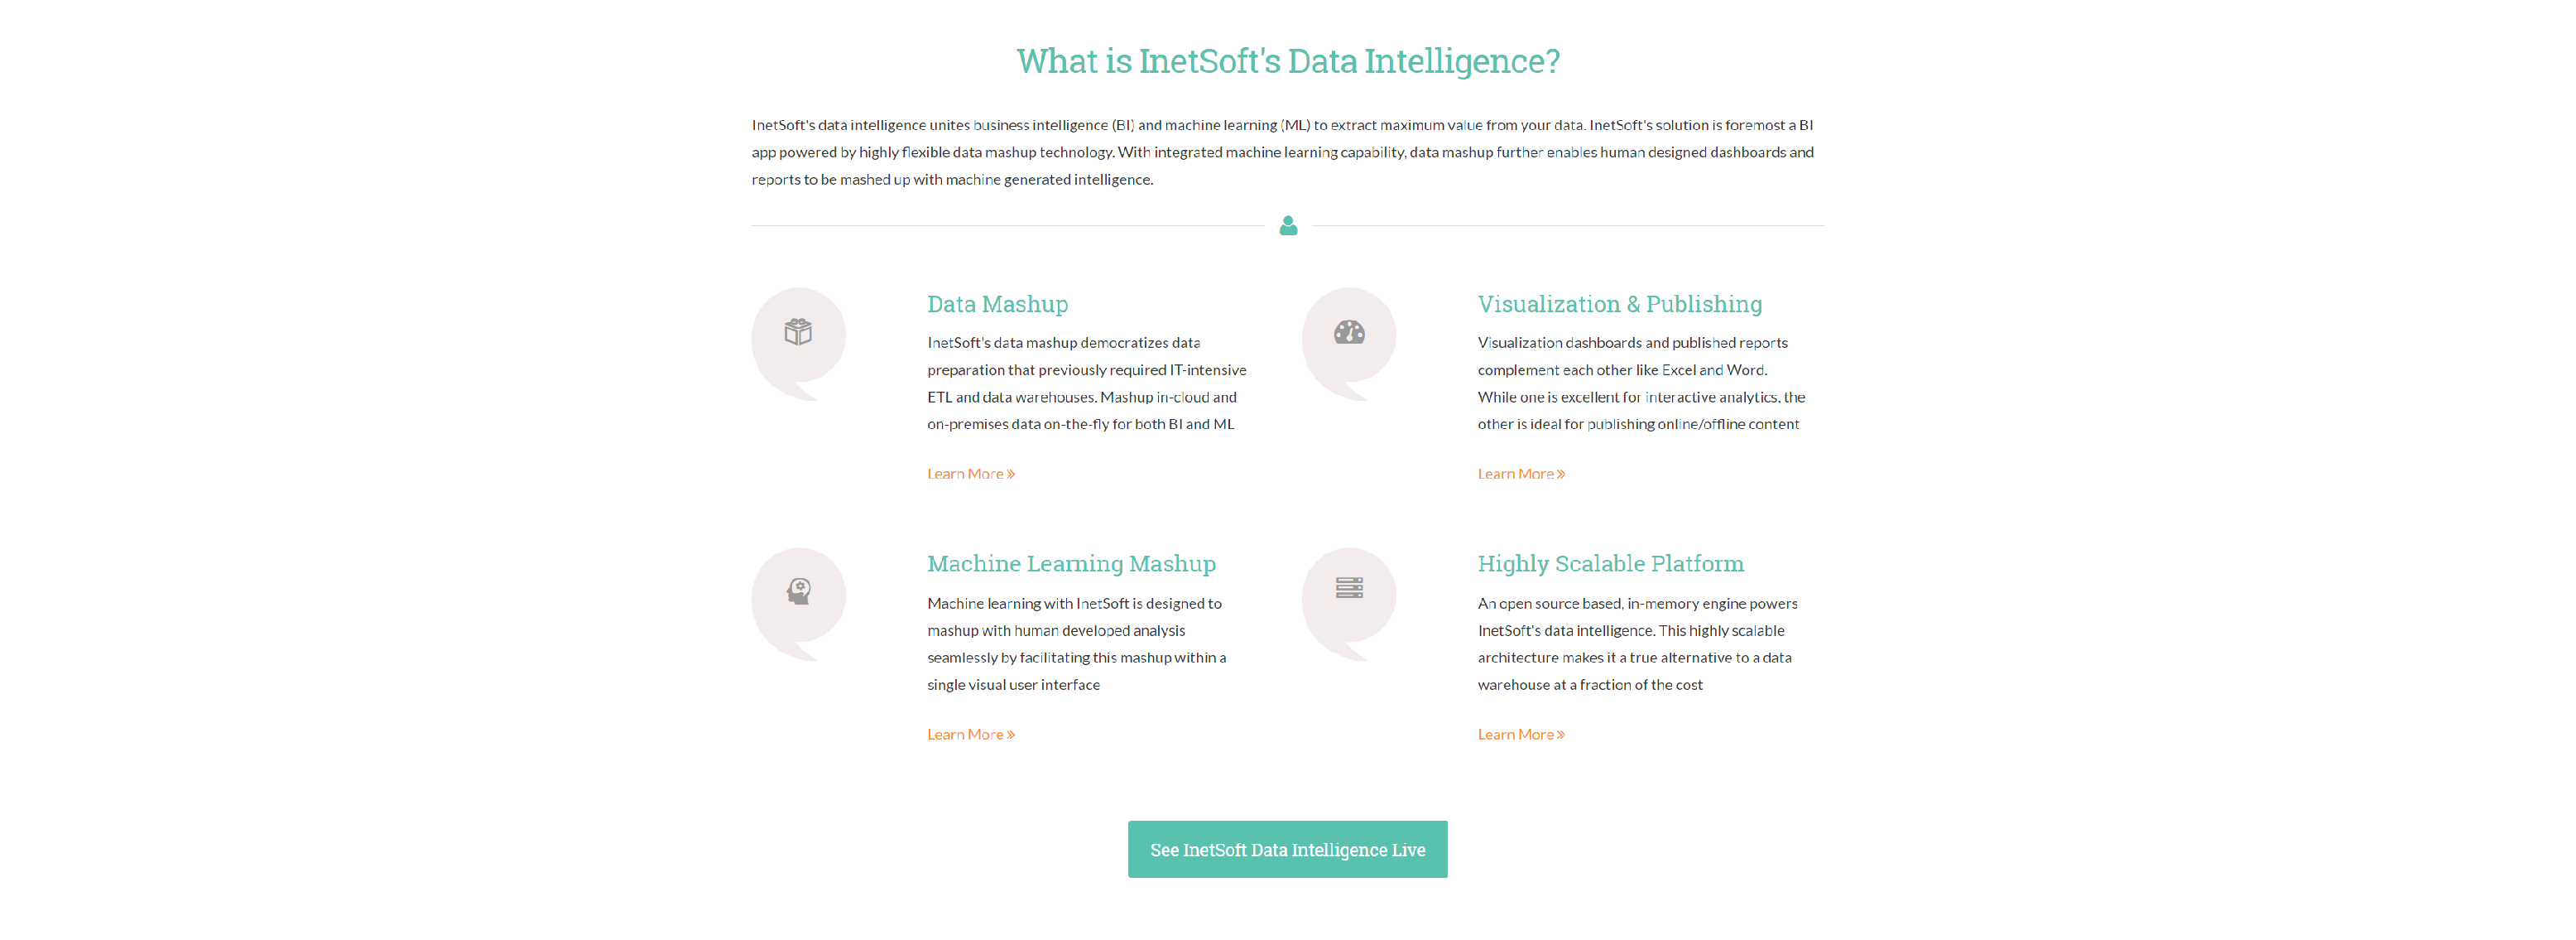
InetSoft’s dashboard sales reporting software lets you create Web-based dashboards that are impactful and actionable.
- Self-Service Dashboards and Opportunity Discovery
- Data Mashup for Holistic Customer Views
- Machine Learning Enhanced Sales Insight
PLECTO

Plecto is a real-time dashboard for data-driven performance optimization. We make it easy for companies to customise their own dashboards and visualize team performance across Marketing, Sales and Service departments.
- Display real-time business performance on any screen
CYFE
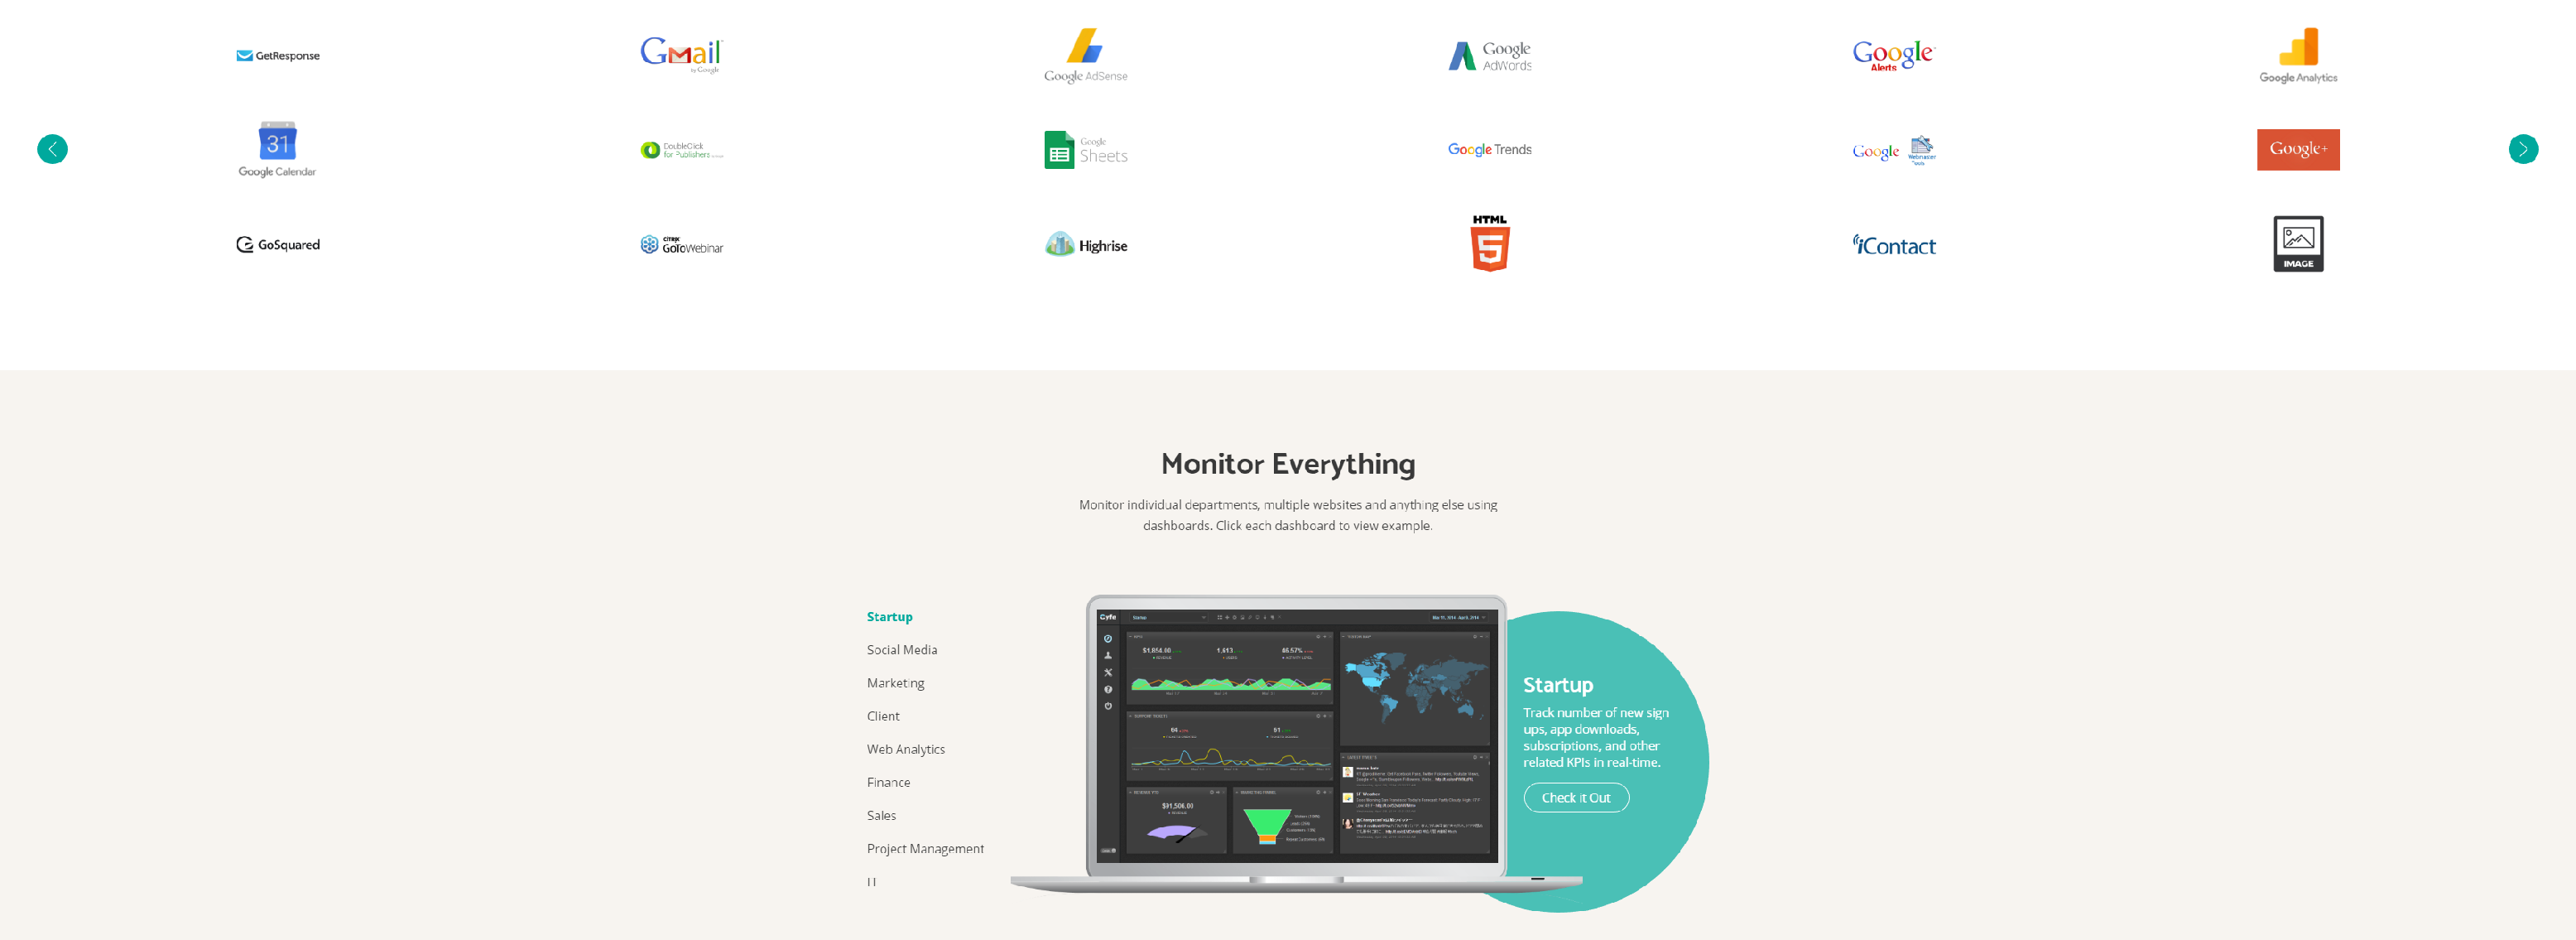
Social media, analytics, marketing, sales, support, infrastructure… all in one place.
- Monitor Everything
- Pre-Built Widgets
- Custom Data Sources
- Real-time Reports
- Data Exports
- Historical Data
- TV Mode
- Customizations
- Social Publishing
- Data Mashups
- Widget Alerts
- Widget Goals
TARGETDASHBOARD
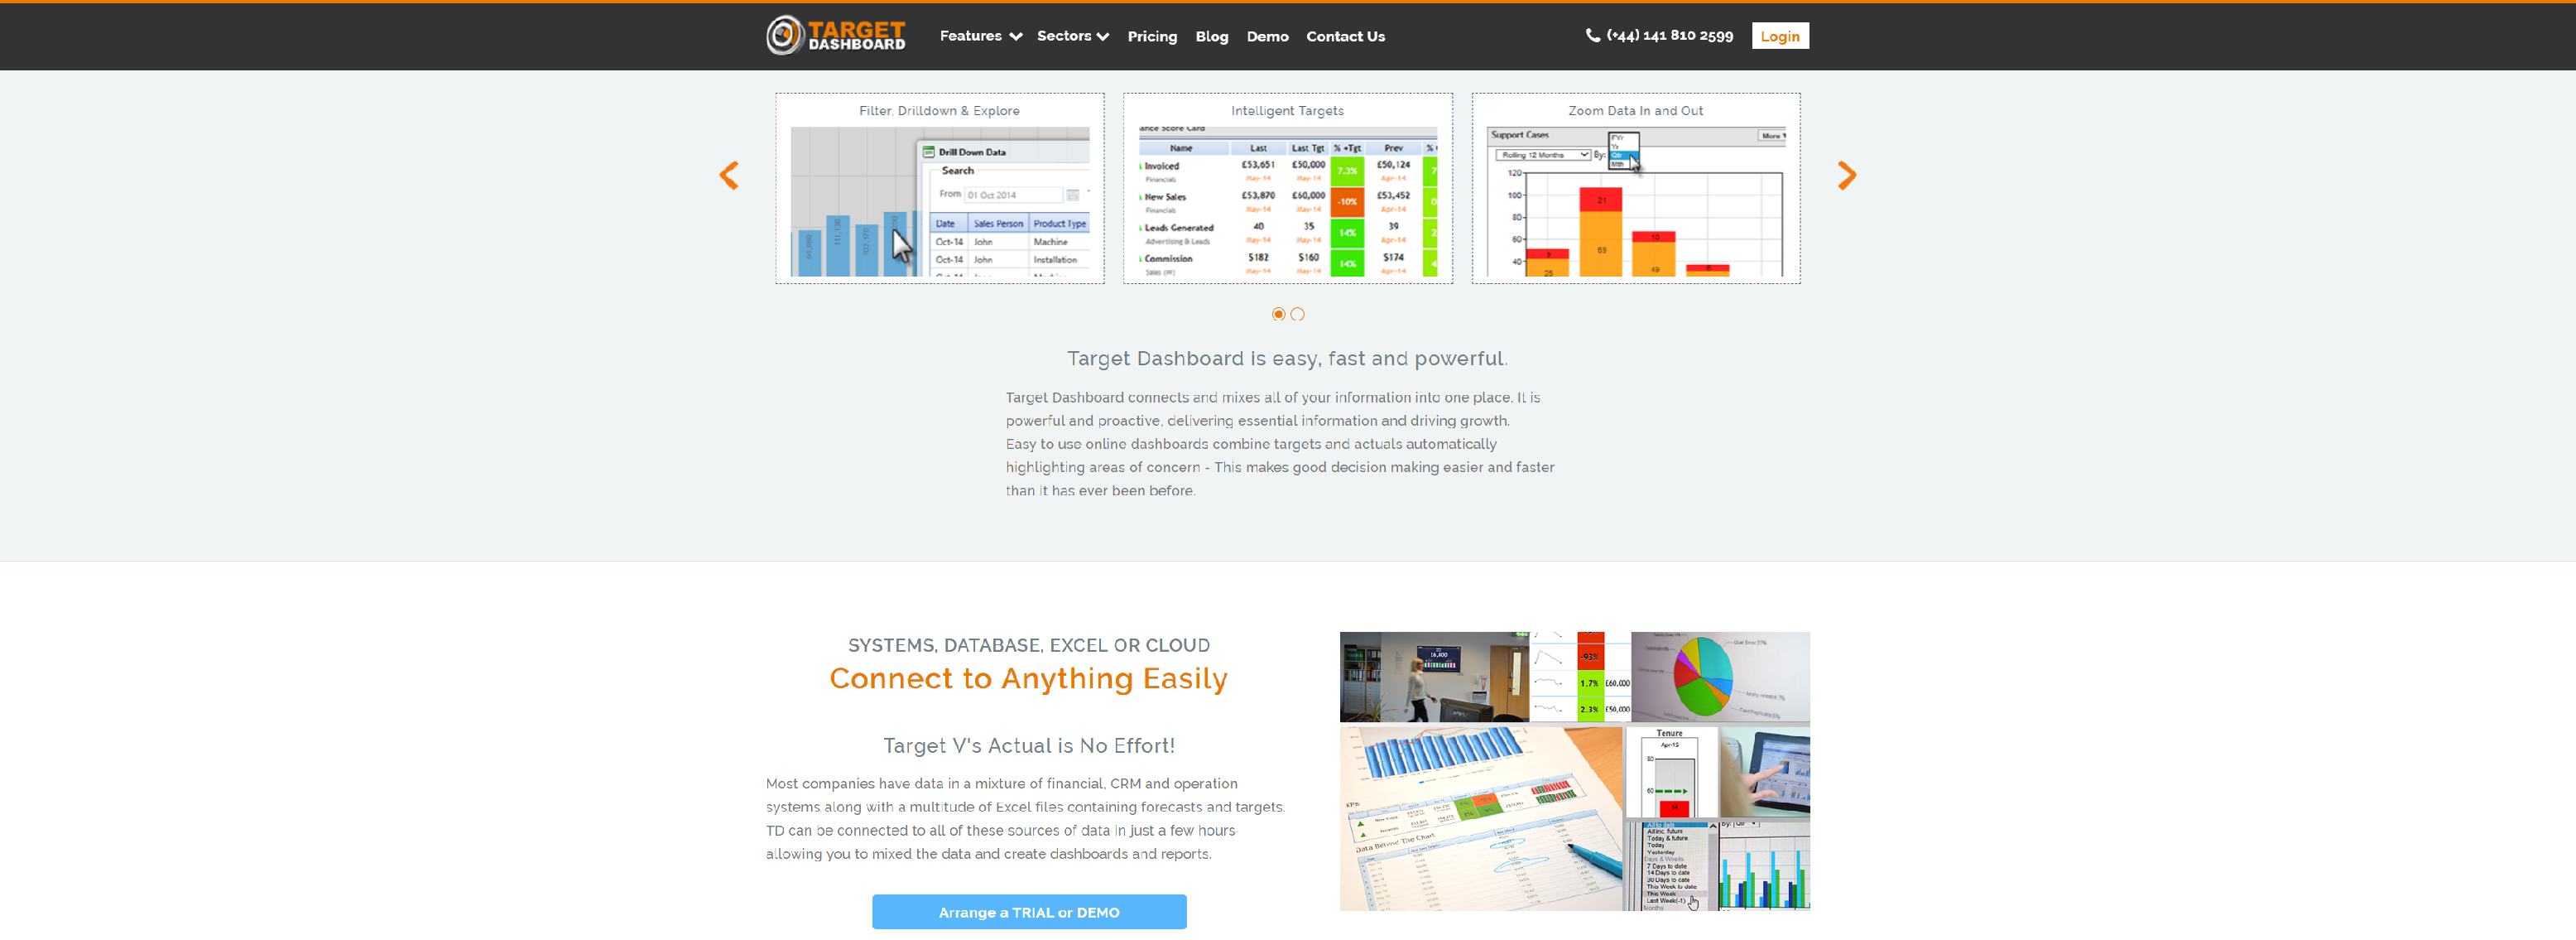
Easily build Powerful, Actionable KPI Dashboards in minutes. Quickly report on data from Excel, SQL databases or 3rd party apps.
- Powerful & Easy to Use for Managers
- Build Dashboards from Your Data in 1 hour!
- See Your Business More Clearly
- Automatically Does Clever Calculations with Your Data
- Not Just Dashboards! Tablets, Wall Mounted Screen & Paper
- Automatic Alerts and Warnings
DYNISTICS
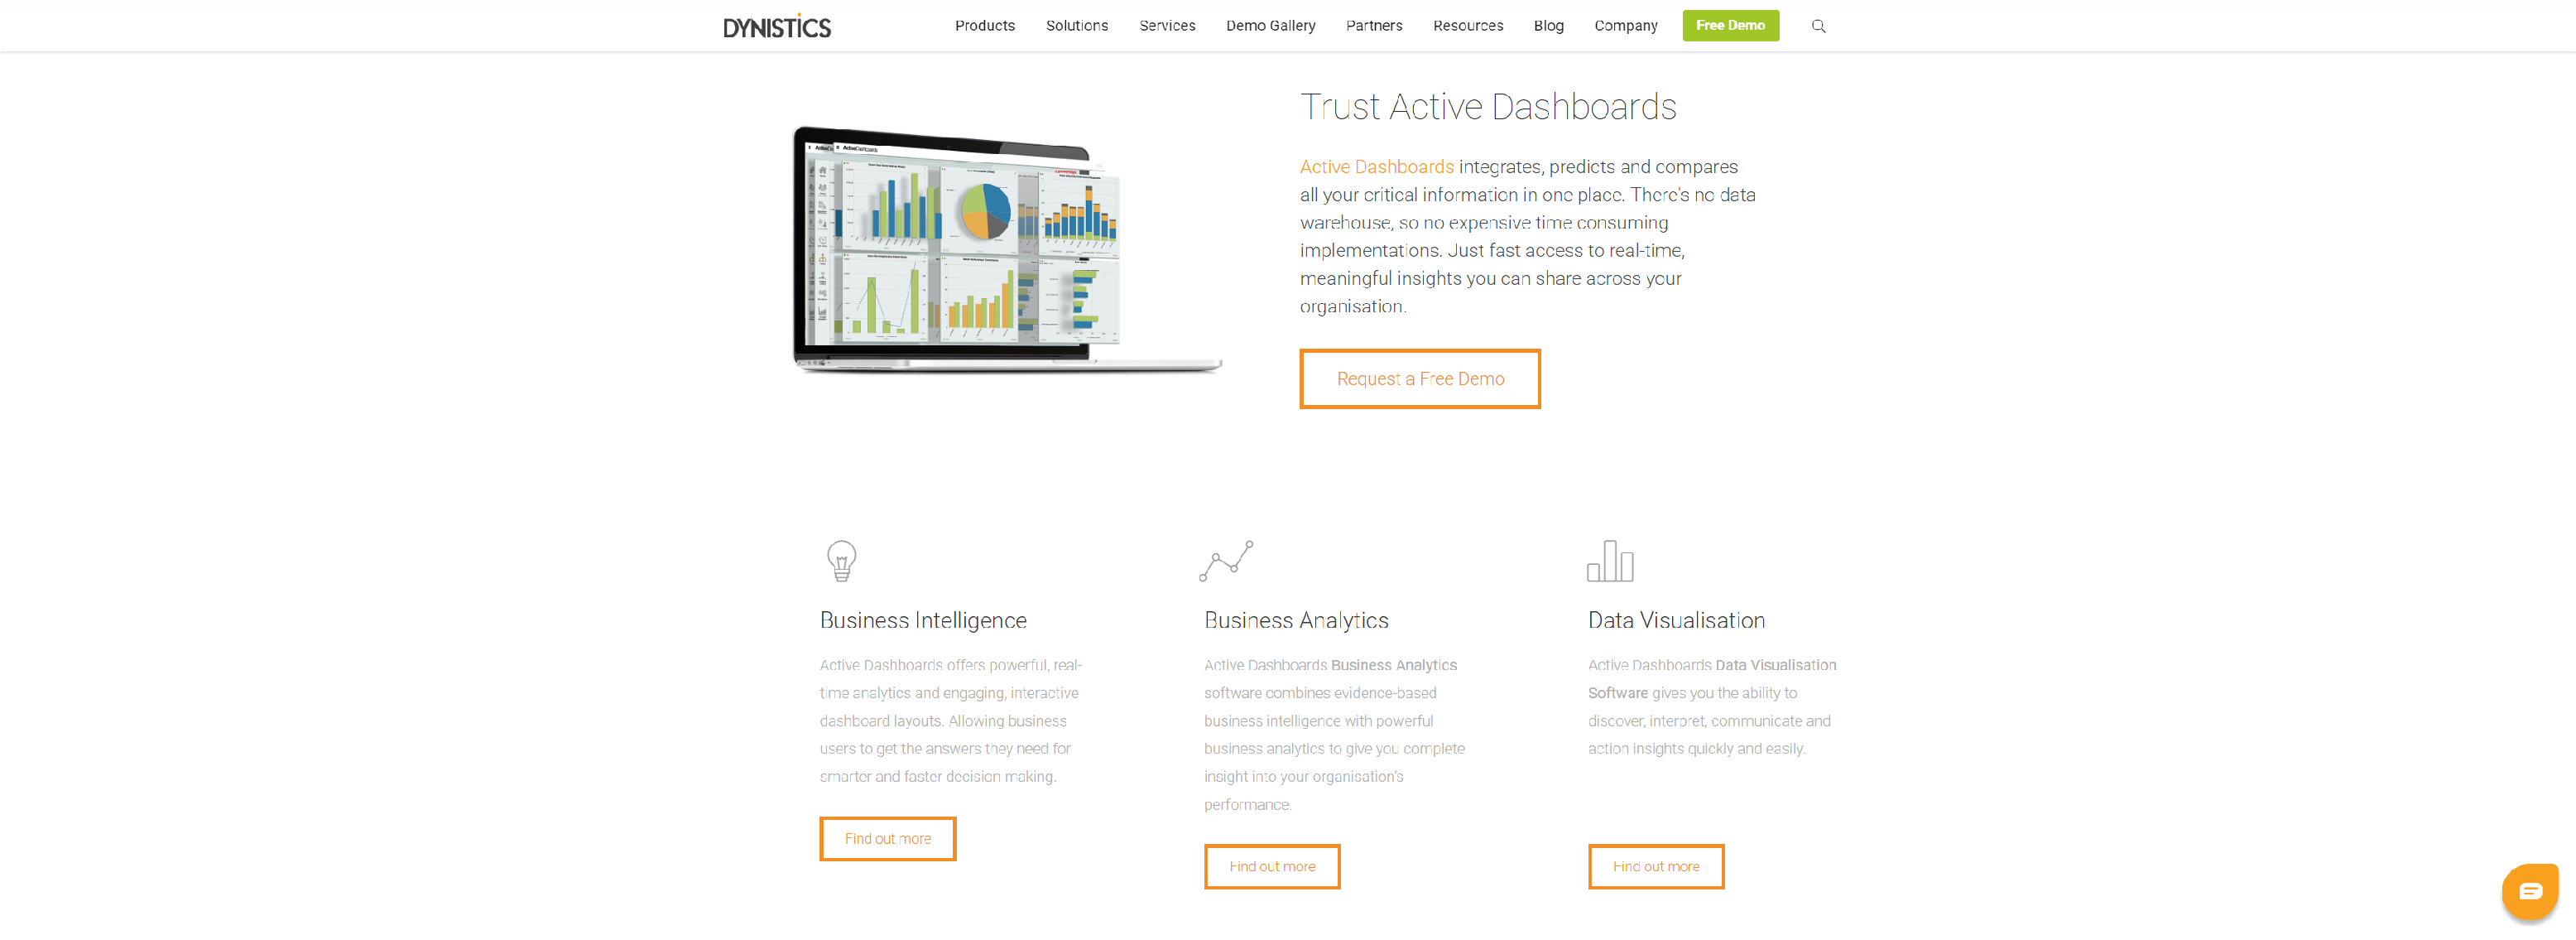
Business Intelligence Dashboard Software from Dynistics makes business reporting and analysis simple with easy to read charts and graphs.
- Efficient pipeline management
- Measure ROI accurately
- Prevent silos
- Data visibility
- Monitor KPIs