A business intelligence software product is exactly what it sounds like. It is a reporting tool that gives your business the intelligence that it needs to succeed. But how does one define success? On a personal level, you do not have to have a lot of money or even any at all to be happy. But when it comes to the often dog-eat-dog world of Corporate America, it is clearly defined in terms of profits and losses. The profiteers are the winners, while the “loss-iteers” are the losers. You want your business to be the former, not the latter, and that’s why you’re looking into what BI reporting tools can do for you.
There are probably things you can do right now at your business to cut expenses, and maybe a few quick fixes for generating extra revenue. But if you want to build long term success, you also need employees that will thrive under your leadership. You need loyalty and longevity and experience. You need to be able to increase productivity without polluting employee culture. How do you do that?
First, look into reporting tools that can give you a clear indication of how productive you are. BI software is about more than dollars and sense. It can also define the productivity of each employee. With the right software at your disposal, you can gauge an accurate starting point for where your employees are, and you can start to define goals for where you want them to be. BI tools help you do all of this, but they cannot make your employees better employees. That is entirely up to you. It is recommended to include employees on the goals that are set for them. Don’t arbitrarily assign expectations and then force them to live up to them. This creates inward hostility in the employee and a wider chasm between them and the company. Too much of this goes on, and there is a huge disconnect that will lead to high turnover rates and poor word of mouth for your organization.
If you can help your employees to feel more comfortable with the purpose of the BI reporting tools, then it is easier to encourage cooperation instead of division. By including them on how the software works and being upfront and honest about what its functions are, you can actually discover a willing partner in the effort to increase productivity rather than an adversary. For too long, managers have looked at BI software as a “gotcha” function for catching poor employees. This furthers the us-versus-them mentality. But if used correctly, your business intelligence tools can be the best thing that has ever happened to your business.
Types of Business Intelligence Reports
One of the most critical components of any business intelligence solutions is its reporting capabilities. After all, making sense of data is what these tools are all about. There are many types of business intelligence reports. Below are a few of the most common types and their functions.
- Ad Hoc Business Intelligence Reports – According to the Encarta Dictionary, ad hoc means “done for a particular purpose.” An ad hoc business intelligence report is typically generated for a particular purpose by users as needed. Some users create ad hoc reports from scratch while others base them off of templates.
- Static Reports – If you’re familiar with Crystal Reports, you’re familiar with static reports. These reports conform to a fixed layout designed by a report designer and can be generated, within the report’s parameters, according to a schedule or upon request by end users.
- OLAP Reports – OLAP reports are typically general purpose reports that can be drilled down by the user to obtain precise data based on their needs. For example, a user viewing a general sales OLAP report could first view the “big picture” and then drill down to view sales data for a given region, customer, sales representative, product, or time period.
- Technical Reports – Technical business reports are generally used by IT personnel and analysts to monitor the business intelligence system, its performance, and its usage. Technical reports are often generated in CSV format for easy export to Microsoft Excel where the data can be filtered, sorted, refined, or exported to other systems.
- Business Intelligence Performance Management Dashboards – Business intelligence dashboards are a form of real-time reporting. Dashboards contain graphical elements such as gauges, charts, and illustrations that present the data visually. Dashboards can include both static and dynamic reports and are highly configurable to best meet the user’s needs.
SISENSE
Business Intelligence software by Sisense, the industry leader in BI for complex data – easily prepare, analyze & explore growing data from multiple sources.
- Embedded Analytics with a Competitive Edge
- Data Mastery for Every User (even non-technical ones)
- Self-Service Analytics That Finally Lives Up to the Name
- Deployment That Moves You Forward (Instead of Holding You Back)
- Give Users the Right Access to Only the Right Data, Nothing More
JINFONET
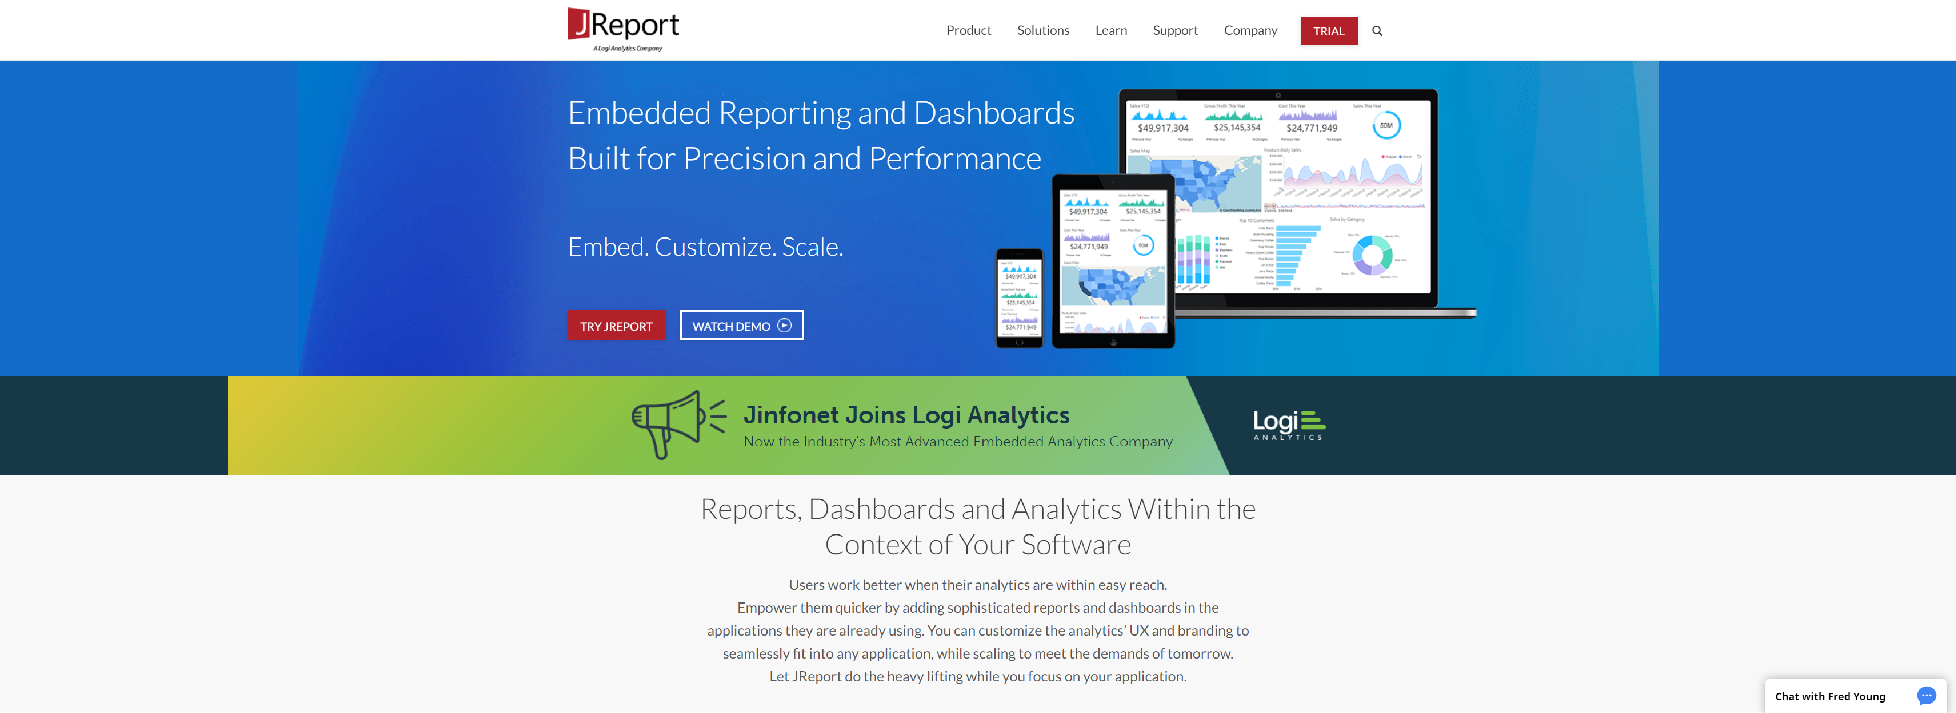
Business Intelligence and Analytics Software that integrates into your applications. See the most powerful and reliable embedded analytics and reporting software for your enterprise now!
Precision Reporting and Dashboards:
- Solve Complexity
- Operational Reporting
- Self-Service Analytics
Scale Your Analytics Workload:
- Deliver Faster
- High Capacity
- Scale with Demand
Embedding and Customization:
- Integrated Security
- Make It Your Own
- Easy to Embed
POWERBI.MICROSOFT
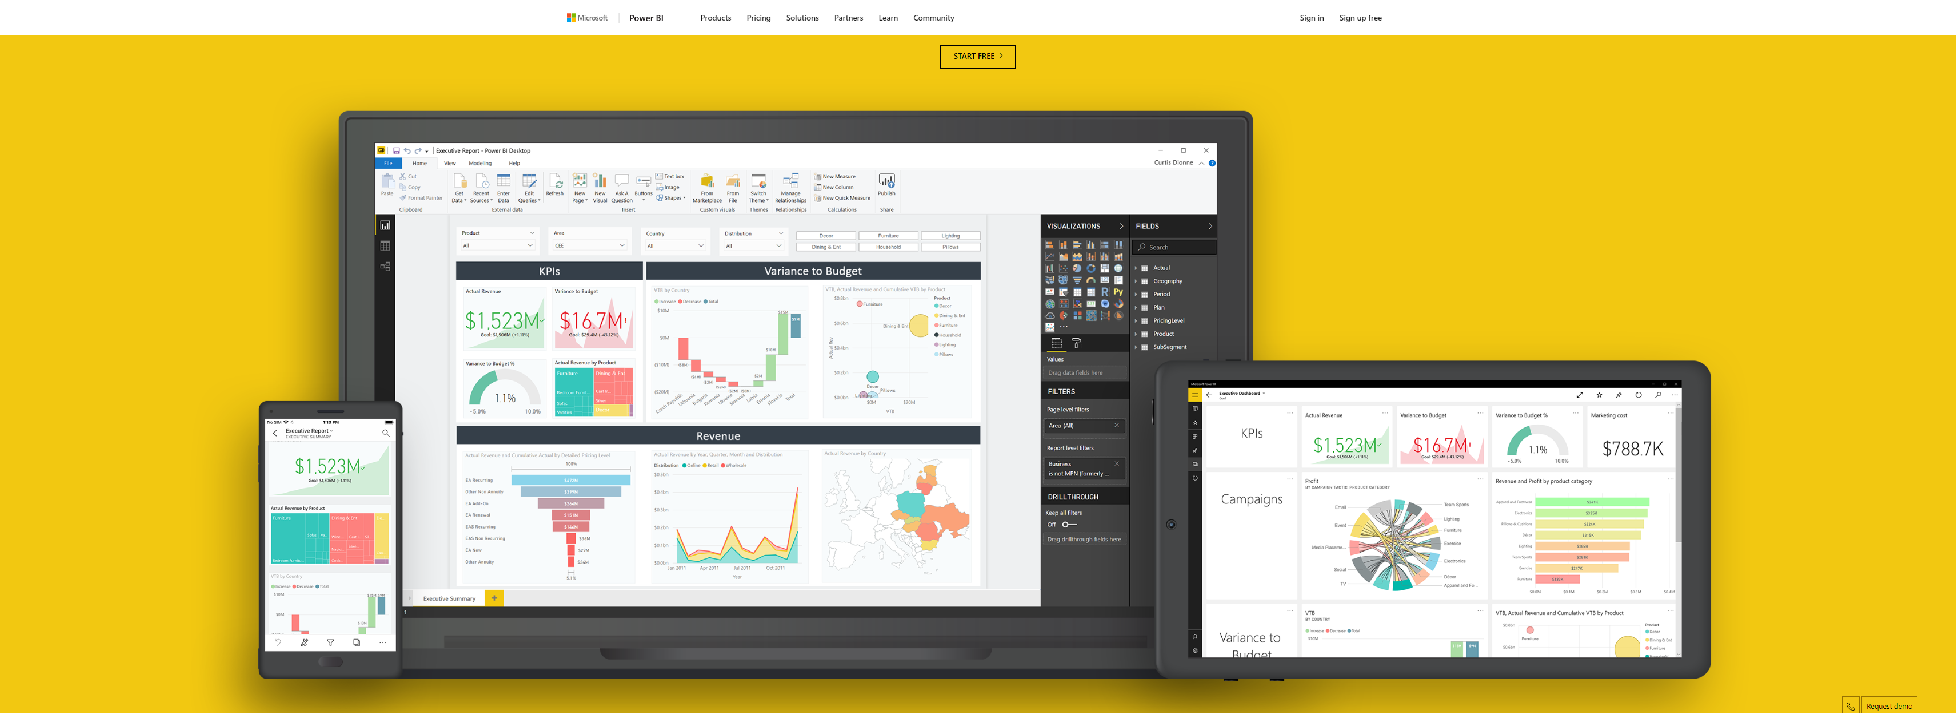
See your company’s data in new ways with interactive data visualization BI tools from Microsoft Power BI.
- Transform data into stunning visuals and share them with colleagues on any device
- Visually explore and analyze data—on-premises and in the cloud – all in one view
- Collaborate on and share customized dashboards and interactive reports
- Scale across your organization with built-in governance and security
KYUBIT
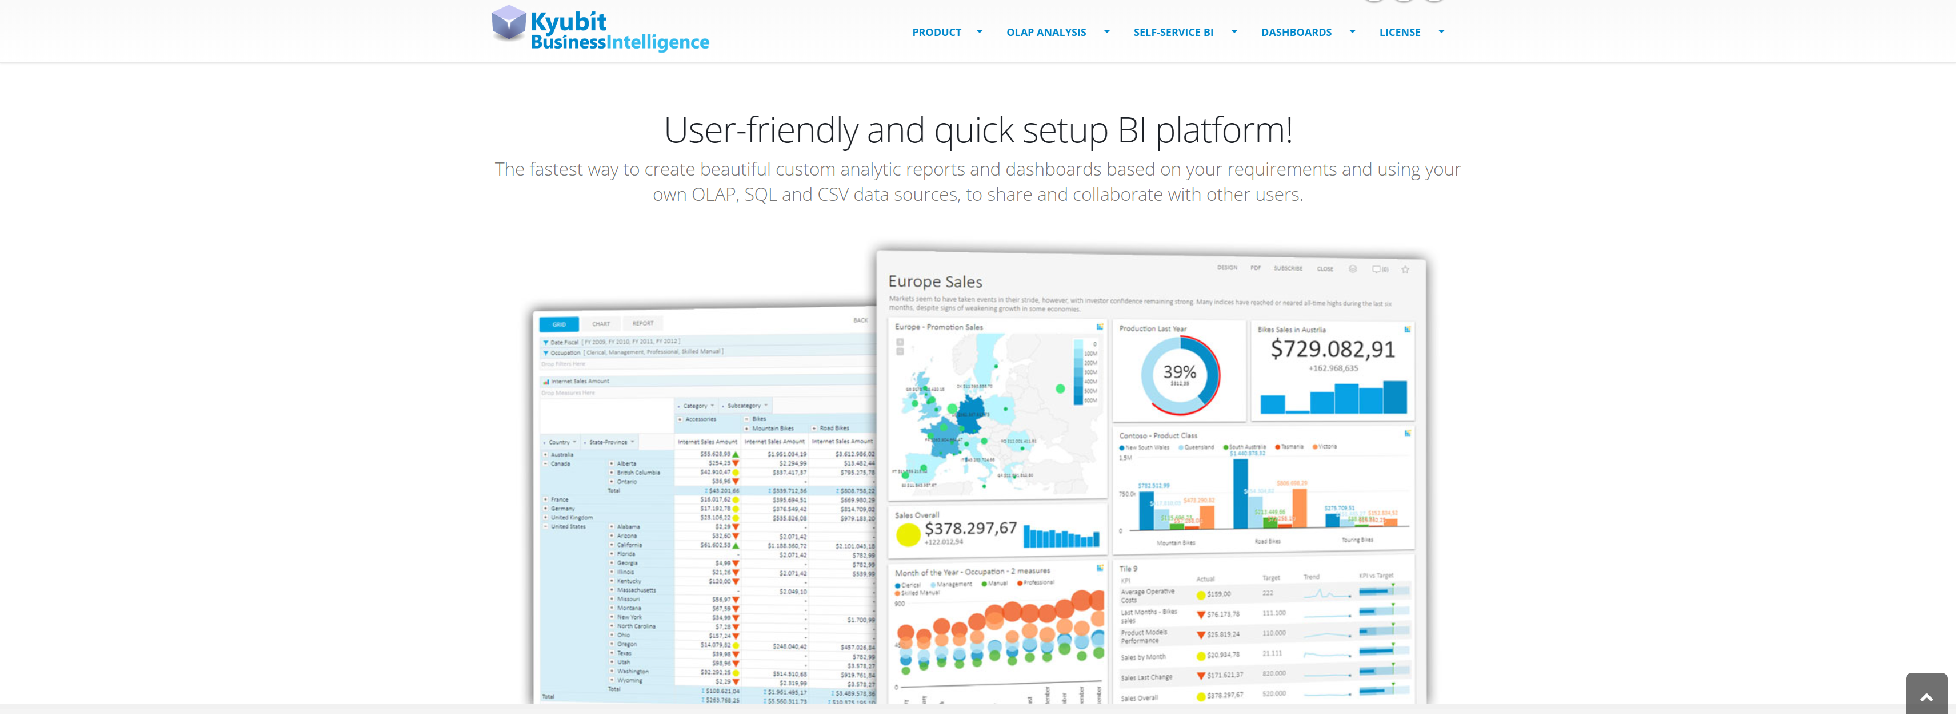
Kyubit Business Intelligence presents set of BI Tools designed for web based OLAP Analysis, OLAP Reporting and Dashboards Software designed for user friendly data analysis and visualizations of your OLAP and SQL data, by creating visual insight, goal metrics and data discoveries.
- OLAP Analysis in your browser
- Self-Service BI with Kyubit
- Analytic Dashboards
- Mobile BI with Kyubit
- Embedded BI features
KLIPFOLIO
Klipfolio is an online dashboard platform for building powerful real-time business dashboards for your team or your clients.
- Dashboard Design
- Building Data Visualizations
- Data Warehouse Reporting
- Mobile BI Dashboard Design
- SaaS Metrics Monitoring
- Self-Service Business Intelligence Tools
LINGAROGROUP
Lingaro BI business consulting unit provides solutions in setting up and re-engineering business intelligence systems.
JASPERSOFT

Jaspersoft world’s most widely used business intelligence suite leverages open source for the best, most cost-effective reporting, dashboards & analytics.
- Stay informed and make better decisions
- Spot trends and identify issues
- View the state of your business
- Build a data-mart or warehouse
- Easy Embedded Analytics That Developers Love And End Users Crave
ADVERITY
Adverity is the best data intelligence software for data-driven decision making. Connect to all your sources and harmonize the data across all channels.
Adverity DataTap – The most complete data integration platform for Fast Paced Enterprises:
- Complete data connector library
- Limitless flexibility & customization
- Scalability for the enterprise
Adverity DataTap – Powerful Visual Analytics for your marketing data:
- Marketing DNA
- Cross-channel analytics
- Powerful dashboards
Adversity presence – AI-powered always on augmented analytics:
- Detect anomalies, act on insights
- Data discovery with a click
- Skyrocket your ROI
FUNNEL
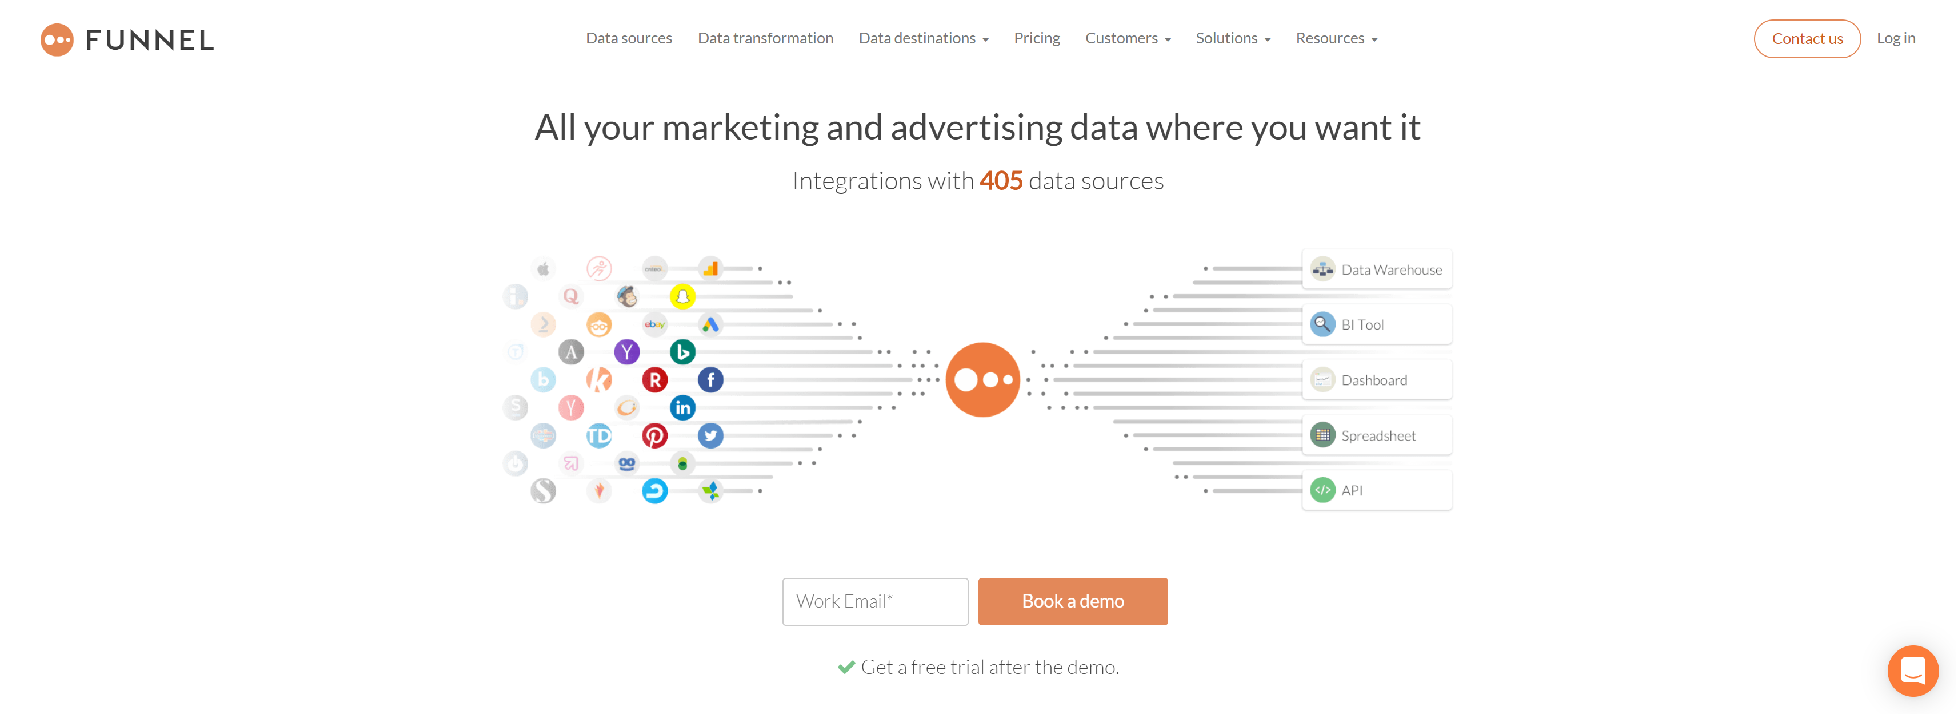
Supports data collection from any marketing or advertising data source and transforms marketing data into automated marketing reports.
- Connect in minutes
- Group your data
- Over 400 marketing sources
- Import historical data
- Data always up to date
- Personalised support
BIRST
Consume enterprise data with easy to use analytics from Birst. Share data across all teams using cloud-based business intelligence and reporting tools.
- Reduced reliance on IT
- Faster decision-making
- Low maintenance costs
- Data in one centralized location
- Data management and ETL capabilities
ELEGANTJBI
ElegantJ BI Software uses the power of Managed Memory Computing to provide a 100% browser based self service BI solution with unbeatable ROI.
- ReImagine Business Intelligence, and the possibilities inherent in business user empowerment, with ElegantJ BI tools and solutions
- Imagine a world where your users can leverage Deep Dive Analytics, and leave behind restrictive Static Packaged Dashboards
- Empower your users to become Citizen Data Scientists with Smarten – Advanced Data Discovery tools powered by ElegantJ BI