One of the most common types of tools for predictive analysis is linear regression. It was Sir Francis Galton who coined the term linear regression in 1877.
Today, linear regression is used in many fields, especially by data scientists in various observations. The basic concept of regression is to observe two major things.
Is predicting a dependent (outcome) variable by a set of predictor variables satisfactory?
Which variables act as significant predictors of the dependent variable, and how do they impact the outcome or dependent variable? (This is indicated by the sign and magnitude of beta estimate)
The relationship between a dependent variable and one or many independent variables is established by regression. The dependent variable goes by many names such as outcome variable, endogenous variable, criterion variable, or regress and. The independent variables are also referred to as predictor variables, exogenous variables, or regressors.
Prediction of values within a continuous range is possible with this.
The very first step to mastering machine learning is by educating yourself about linear regression. You are required to be confident with basic equations and mathematics.
The linear regression simple equation is given as: Y= m*x + b where,
- Y= dependent variable
- X = independent variable
- b = intercept (where the line starts)
- m = slope (where line moves)
What are the major uses of regression analysis?
Regression analysis target three main areas. They are:
- To determine the strength of predictors
- Effect forecasting
- Forecasting a trend
I. The strength that the independent variable has on a dependent variable is determined by regression. The strength of the relationship between affect and cause, marketing and sales expenditures, income, and age are examples.
II. Forecasting of the impact of change or effects can also be done by regression. The change of the dependent variable for the change of the independent variable is understood with regression analysis. “How much income in sales is required for each additional $10000 spent on marketing” is a typical question.
III. Prediction of future values and trends is possible because of regression analysis.
Point estimates are obtained by regression. “Price of gold in the future” is a typical question.
What are the steps to follow for solving the regression model?
It is an absolute must to understand the two major steps to solve the linear regression algorithm as it is a very important algorithm to answer linear regression.
- Cost function or Mean Squared Error (MSE)
- Gradient descent
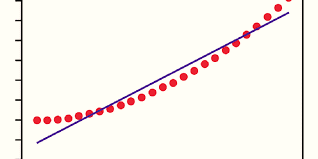
If you take any Linear regression model and observe it, you will find many dots scattered on the image. What are those dots? The dots are nothing but your precious data. There is also a center line between the dots. This is nothing but the best fit line. The best fit line can be drawn with our own prediction using our data set. This will have the least error.
- The Mean squared error or cost function allows you to find out the approximate values for b and m, which will give the best fit line for the data points. As we aim for getting the best values of b and m, we convert this into a minimization problem. This minimizes the error between the actual value and prediction value. This is done by squaring the error difference, summing all data points, and dividing the value obtained by the total number of data points considered. By doing this, the average squared over of all the data points is provided.
- Using the cost function, we have obtained a minimum error value. The concept which comes next to comprehend linear regression is gradient descent. This is done by updating b and m to minimize the cost function (MSE). The major idea in this is that you begin with few values for b and m, and then iteratively, we change these values to minimize the cost. The Gradient descent supports us on how to change values.
You will get your best fit line by following the above two steps. New values can be predicted easily by using the best fit line.
Types of Linear Regression
Linear regression is classified into two types, which are:
- Simple linear regression
- Multiple Linear regression
Simple Linear Regression:
In simple linear regression, we try to establish a relationship between input, a single independent variable, and an output, a corresponding dependent variable. This can be shown in the form of a straight line.
The line equation is given by:
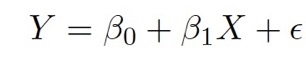
Where Y is the dependent variable or output
β0 represents the intercept, and β1 represents the slope (coefficient). Both are two unknown constants.
The error term is ε.
There is only one predictor variable in simple linear regression.
Simple Linear Regression examples
- Based on the amount of rainfall, crop yields can be predicted. Here, the independent variable will be the amount of rainfall, and the dependent variable is the yield.
- Student scoring marks based on the number of hours committed to studying. Here, the number of hours committed to studying is the independent variable, and the marks scored is the dependent variable.
- Based on the years of experience of a person, his or her salary is predicted. Here, the experience is taken as the independent variable, and salary is the dependent variable.
(ii) Multiple Linear Regression
Using multiple linear regression, we try to establish the relationship between two or more inputs: independent variables and the corresponding output, which is the dependent variable. There are continuous independent variables and categorical independent variables.
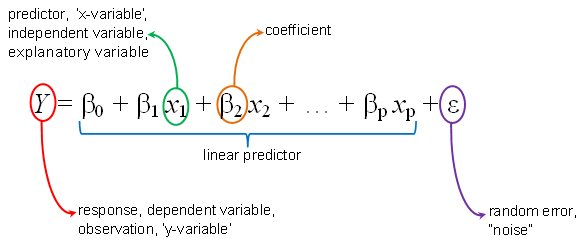
The equation given below shows the relationship between predicted values (y) and independent variables (p). This is known as multiple linear regression.
Areas where multiple linear regression can help us:
- Trends and future values can be easily predicted using multiple linear regression. It can be used to obtain point estimates swiftly.
- Forecasting the effects or impacts caused by changes can be done by multiple linear regression. This analysis can help us comprehend how much the dependent variable will change when the independent variables change.
- Strengths of the effect that the independent variables possess on the dependent variable can be identified with multiple linear regression.
Tips on improving your linear regression models
(i) Fit many models
You must aim to build simple models. Your model necessarily doesn’t mean it’s great just because you have used many independent variables. Using different combinations of variables, try to build multiple regression models. By doing so, you can get a good model.
(ii) Exploratory analysis
By exploratory analysis, you can get a good model. It is an absolute must to understand the relationship between the independent and dependent variables and whether they possess a linear trend. After that, you can use them in your model to obtain a good output. Outliers or extreme values should be checked and treated. The extreme values can skew your predicted estimate values if they are left unchecked.
(iii) Relevant variables to be graphed
Always ensure that you focus on simple plots that help in understanding the model. To judge your model, you will require some simple factors. Those factors are R square, adjusted R square, p-value, and coefficient values.
(iv) Transformations
Transforming every variable in sight should be your goal. Transform logarithms of all positive variables. Based on the potential range of data, standardizing should be done. By doing so, coefficients can be directly interpreted and scaled. Before multilevel modeling, transformation should be done.
(v) Coefficients
Coefficients do not necessarily have to vary by group. Permit coefficients to vary in the model. If the estimated variation scale is a bit too small, you can ignore it if that is more convenient.
Owing to its simplicity and sturdiness, linear regression models are popular. Machine learning models cannot describe a system, but linear regression can. Linear regression should be your primary choice when you wish to model a numerical value.
Reference link- https://towardsdatascience.com/linear-regression-detailed-view-ea73175f6e86