Linux server monitoring tools are software utilities that help system administrators keep track of the performance, health, and status of Linux servers. These tools can provide information on various metrics like CPU usage, memory usage, disk space, network activity, running processes, and much more. Monitoring these aspects ensures that any issues are detected early, minimizing downtime and improving server efficiency.
Discover are top 10 Linux server monitoring tools
Signoz
SigNoz is an open-source observability platform built on OpenTelemetry, offering a comprehensive solution for APM, logs, traces, metrics, exceptions, and alerts – all in one tool.
- SigNoz provides detailed distributed tracing, helping you visualize the journey of requests across microservices and identifying performance bottlenecks
- With APM, SigNoz tracks the performance of your applications in real-time, allowing you to monitor request rates, error rates, and response times
- SigNoz helps you collect and visualize metrics from your services to understand resource consumption, system performance, and trends
- SigNoz integrates log collection and analysis, enabling you to correlate logs with traces and metrics for easier troubleshooting and root-cause analysis
- Set up alerts based on predefined thresholds for key performance indicators (KPIs) to stay informed of system issues in real time
- Track and analyze exceptions within your application, helping to quickly pinpoint errors and resolve issues efficiently
- SigNoz is built on OpenTelemetry, ensuring that it’s fully compatible with the standard for collecting, processing, and exporting telemetry dataPerform in-depth query-based analysis of traces, logs, and metrics to gain deeper insights into your application’s performance
- It is designed to scale with your infrastructure as it grows, making it suitable for both small and large deployments
Checkmk
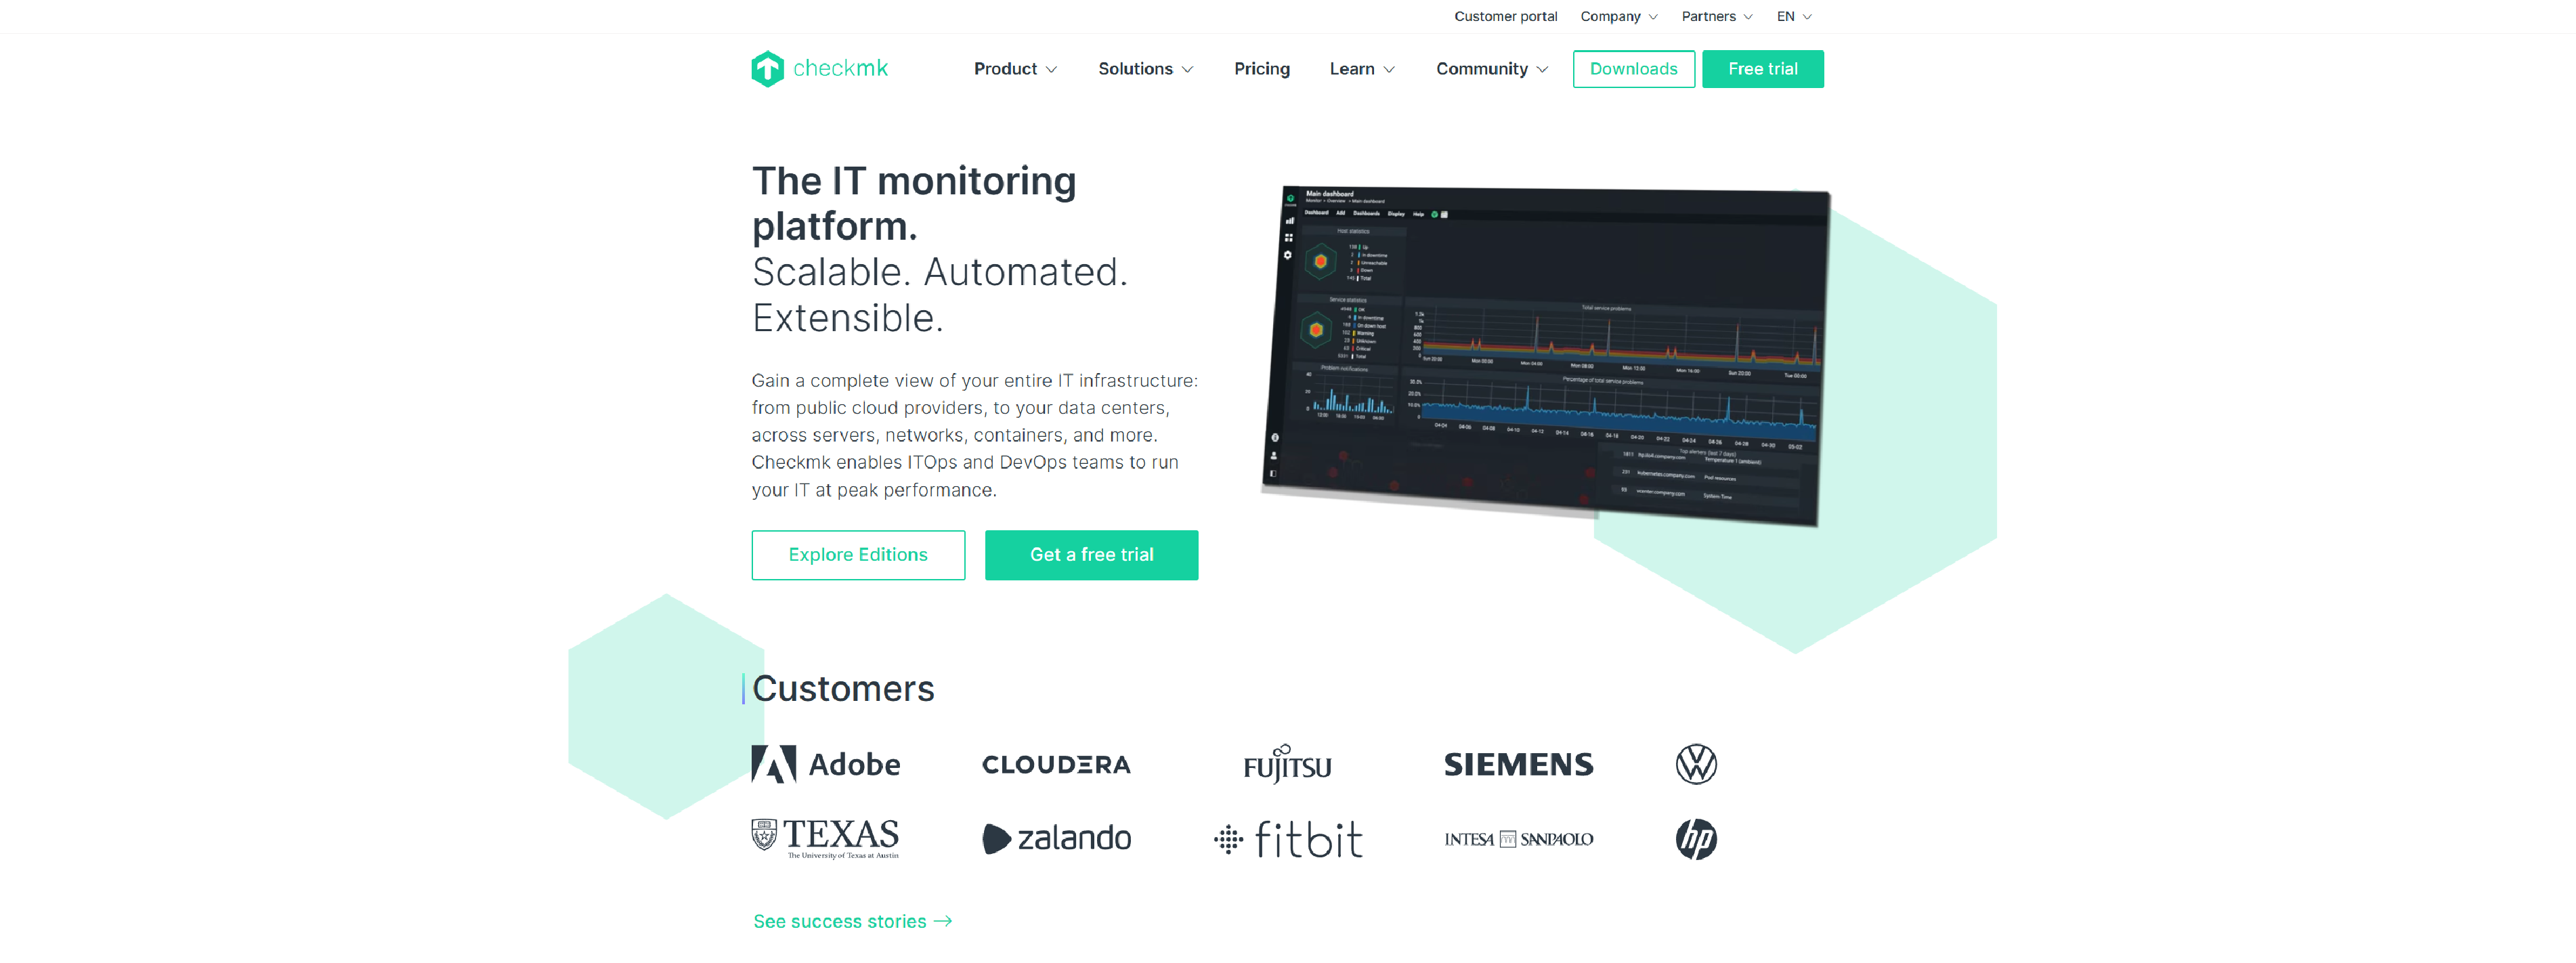
Checkmk provides a comprehensive view of your entire IT infrastructure, including public cloud providers, data centers, servers, networks, containers, and more, empowering ITOps and DevOps teams to optimize performance across your systems.
- Streamline monitoring with automation to save time
- Set up monitoring in just 10 minutes
- Ready to handle powerful hybrid IT monitoring
- Scale your monitoring with a distributed, performance-optimized architecture
- Embrace modern monitoring practices for both cloud and on-premises environments
- Gain detailed insights into your network’s performance
- Easily customize or extend monitoring to fit your specific needs
- Visualize data with modern, customizable dashboards
- Prevent notification overload with smart, granular alerting
- Combine metrics and log data for quicker problem identification and root cause analysis
- Leverage advanced analytics to predict trends and resource utilization
- Keep track of the health of key business processes
- Identify and manage all IT assets
- Proactively keep your business updated with automatically generated reports
- Integrate with leading ITOM/ITSM tools for streamlined workflows
- Connect monitoring data to other tools for enhanced functionality
Nagios
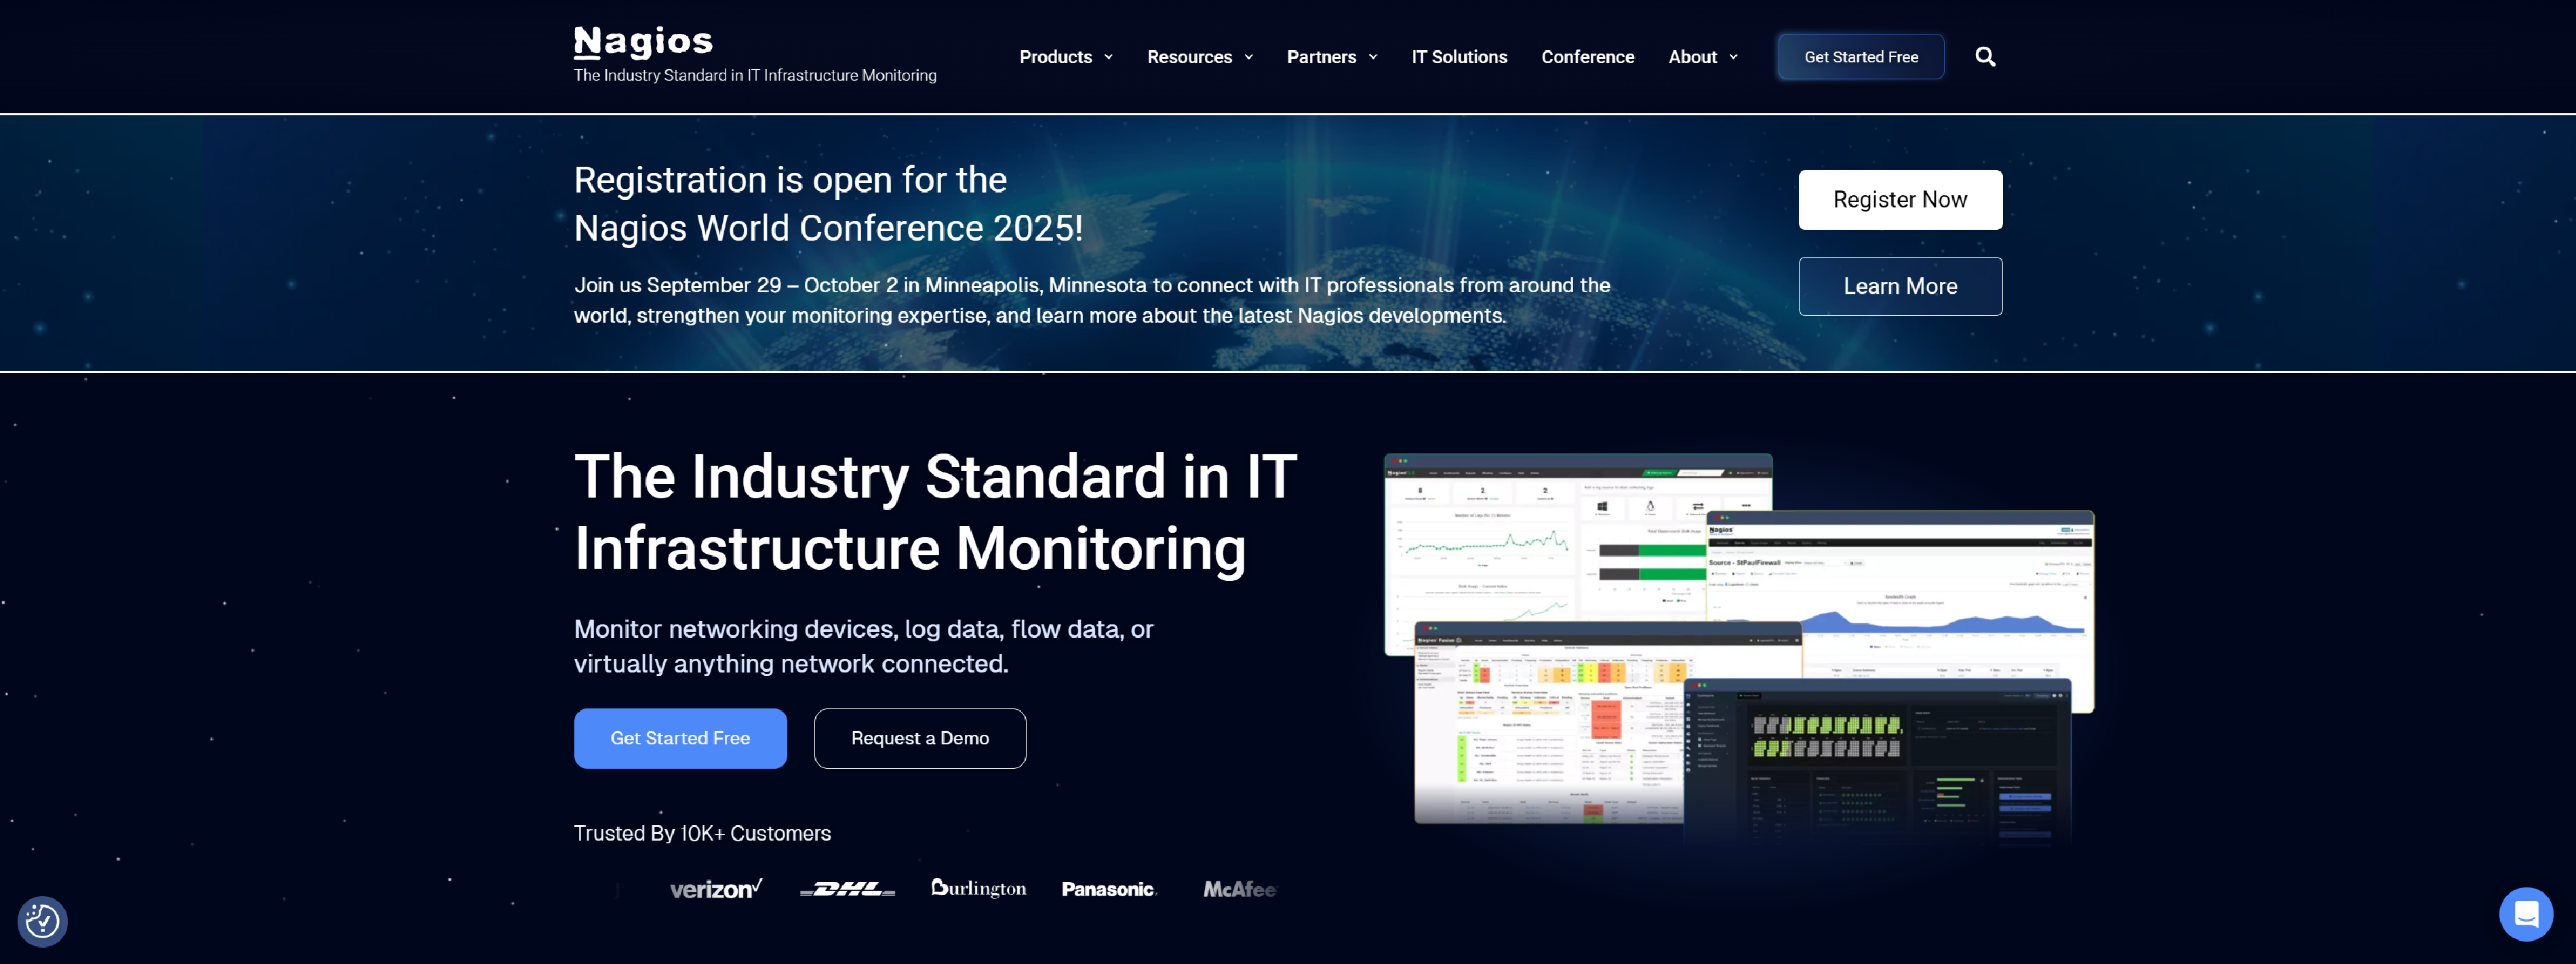
Nagios offers comprehensive monitoring for Linux operating systems and distributions, tracking system metrics, service and process states, file system usage, and more. By using Nagios to monitor your Linux environment, you’re leveraging one of the most powerful monitoring tools available.
- Nagios offers in-depth monitoring for Linux systems, including metrics like CPU usage, memory consumption, disk I/O, and network performance
- Tracks the status of essential services running on your Linux system, such as web servers, database services, and custom application services
- Monitors individual processes to ensure they are running as expected, and alerts you if any process fails or reaches abnormal resource usage
- Keeps an eye on disk usage and file system health, alerting you when disks are nearing full capacity, or experiencing other issues like I/O performance degradation
- Configures customizable alerting and notification systems to warn you of any system anomalies or failures based on predefined thresholds
- Easily scales to monitor small to large environments, from single Linux servers to complex multi-server infrastructures, with distributed monitoring options
- Provides an intuitive, web-based dashboard for monitoring system performance, viewing alerts, and managing configurations from anywhere
- Centralizes the monitoring of your Linux systems, allowing you to easily manage and track the health of your entire infrastructure from a single location
- Leverages a wide range of plugins to monitor third-party applications, services, and devices, giving you flexibility in what to track
- Offers detailed reports and customizable dashboards to visualize system metrics and performance trends, making it easier to track historical data
- Seamlessly integrates with other IT tools, including configuration management and ticketing systems, to streamline workflows and incident management
- Supports automated responses and remediation actions when specific conditions or thresholds are met, helping to maintain system stability
- Ensures your systems are secure by monitoring security-related metrics, like failed login attempts or unauthorized changes, and helps with compliance reporting
Dynatrace
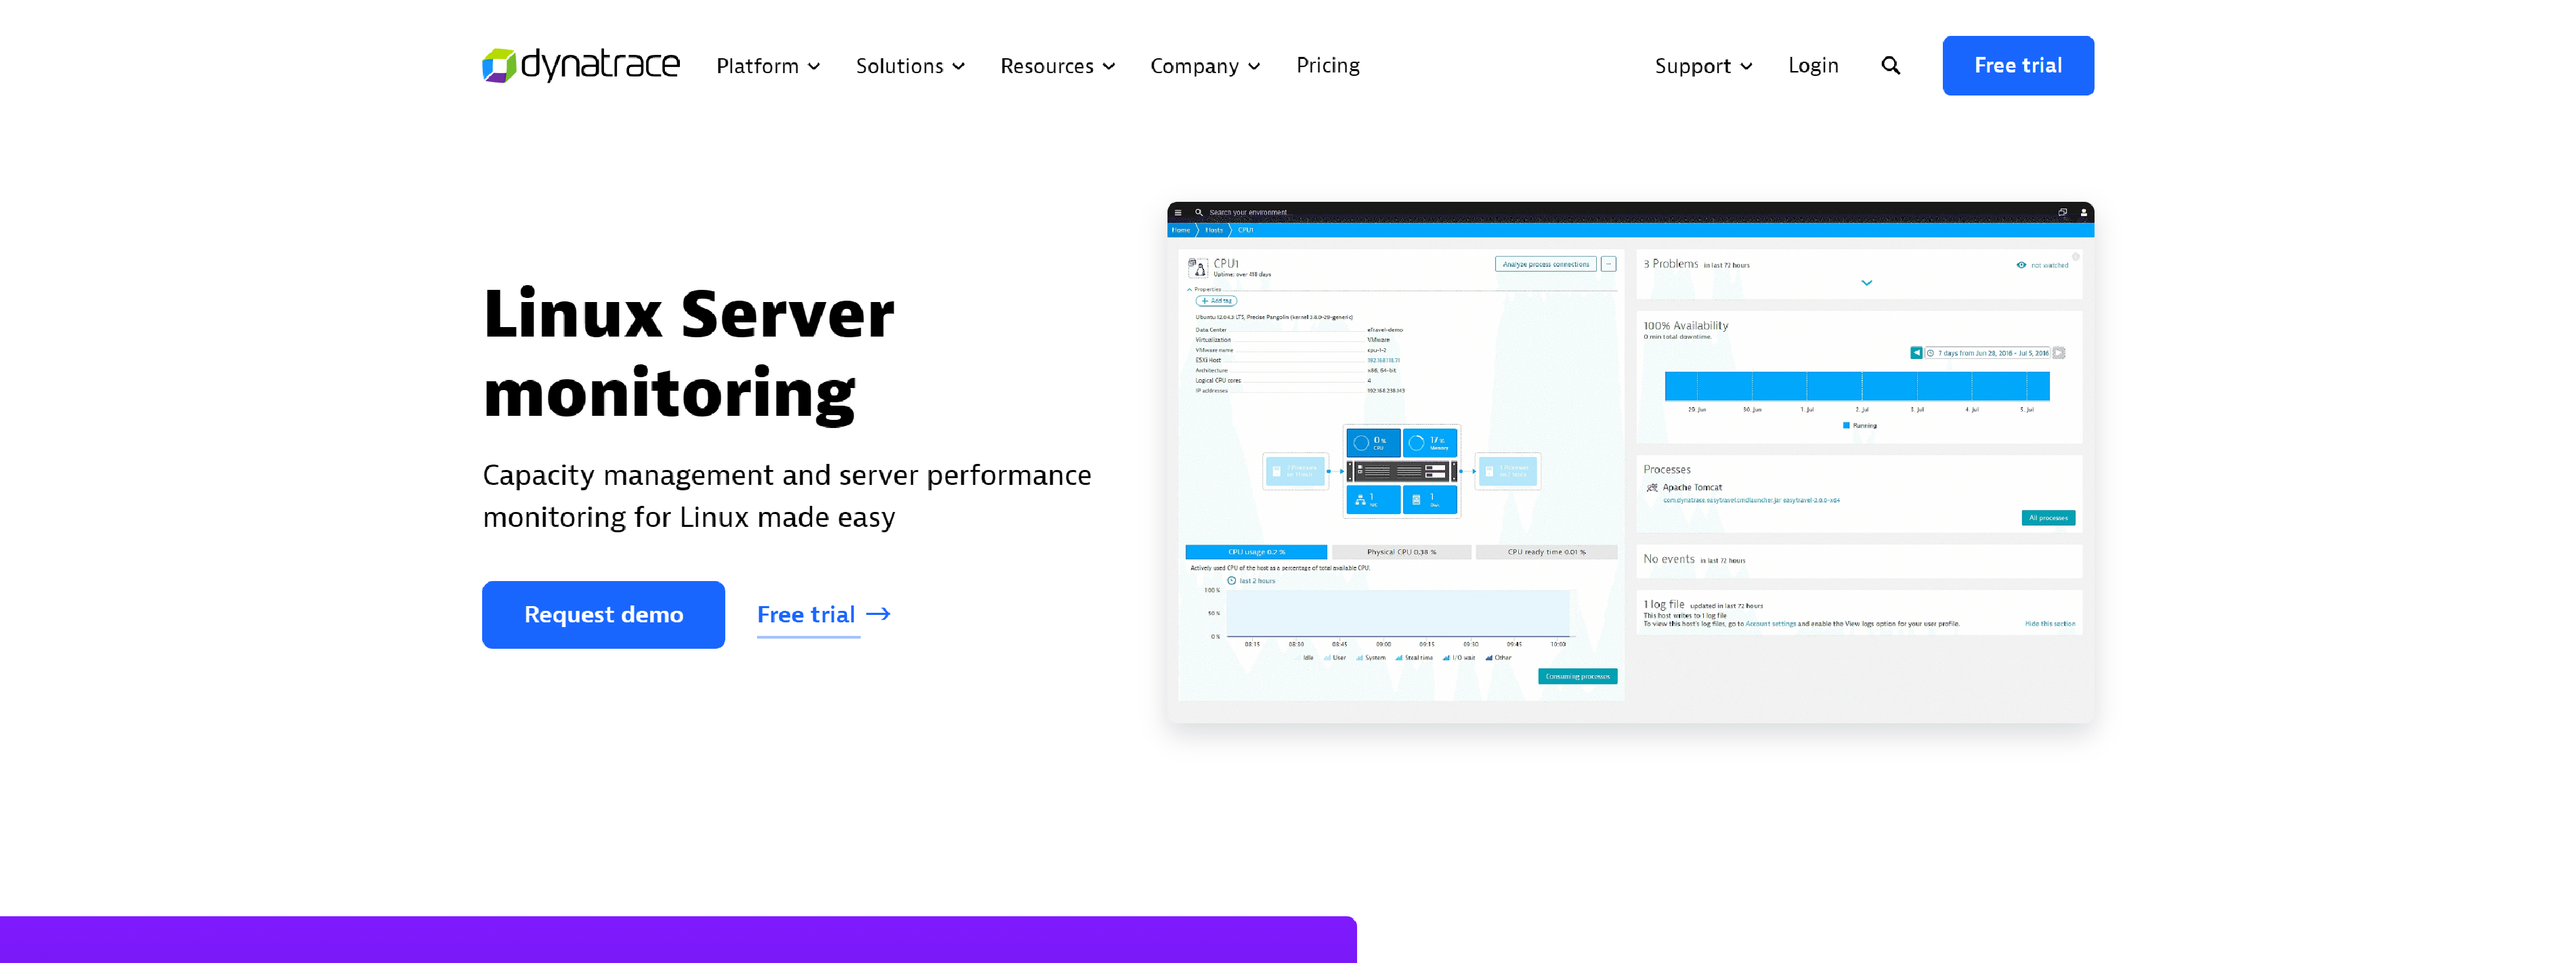
Dynatrace provides server monitoring for physical and virtual Linux hosts, as well as cloud environments, helping to enhance capacity management through detailed Linux server performance monitoring.
- In less than five minutes, Dynatrace provides detailed insights into your servers’ CPU, memory, and network health metrics, down to the process level
- Ensure optimal cloud application delivery and gain visibility into how your applications are deployed across cloud instances
- Dynatrace offers a complete view of your virtualized network infrastructure
- Beyond server monitoring, Dynatrace automatically learns and understands the full architecture of your applications
Solarwinds
SolarWinds offers continuous server monitoring, cross-stack correlation for hybrid IT environments, and the flexibility to monitor custom applications.
- Monitors the health and performance of Linux servers, including metrics like CPU usage, memory, disk I/O, and network performance
- Enables cross-stack visibility, allowing you to correlate data from Linux servers with other parts of your IT infrastructure, ensuring a more holistic view of your environment
- Provides real-time monitoring of system metrics, helping you track performance changes and issues as they occur
- Supports monitoring of custom applications on Linux servers, giving you flexibility to track performance metrics specific to your environment
- Configurable alerts to notify you of performance issues, allowing you to take quick action before problems escalate
- Generate detailed reports on resource utilization, helping you identify potential bottlenecks and optimize server performance
- Provides an intuitive, user-friendly interface that simplifies monitoring and troubleshooting, making it easy to keep track of your Linux server health
- Automates the monitoring process to reduce manual configuration efforts, allowing you to focus on addressing performance issues
- Allows integration with cloud environments, providing seamless monitoring across hybrid and multi-cloud infrastructures
- Offers the ability to analyze historical performance data, helping to detect trends, predict future resource needs, and make proactive optimizations
- Centralizes monitoring for your entire Linux infrastructure, offering a single pane of glass for tracking performance across your IT stack
- Scales with your environment, supporting both small and large deployments, and adapts as your infrastructure grows
Poweradmin
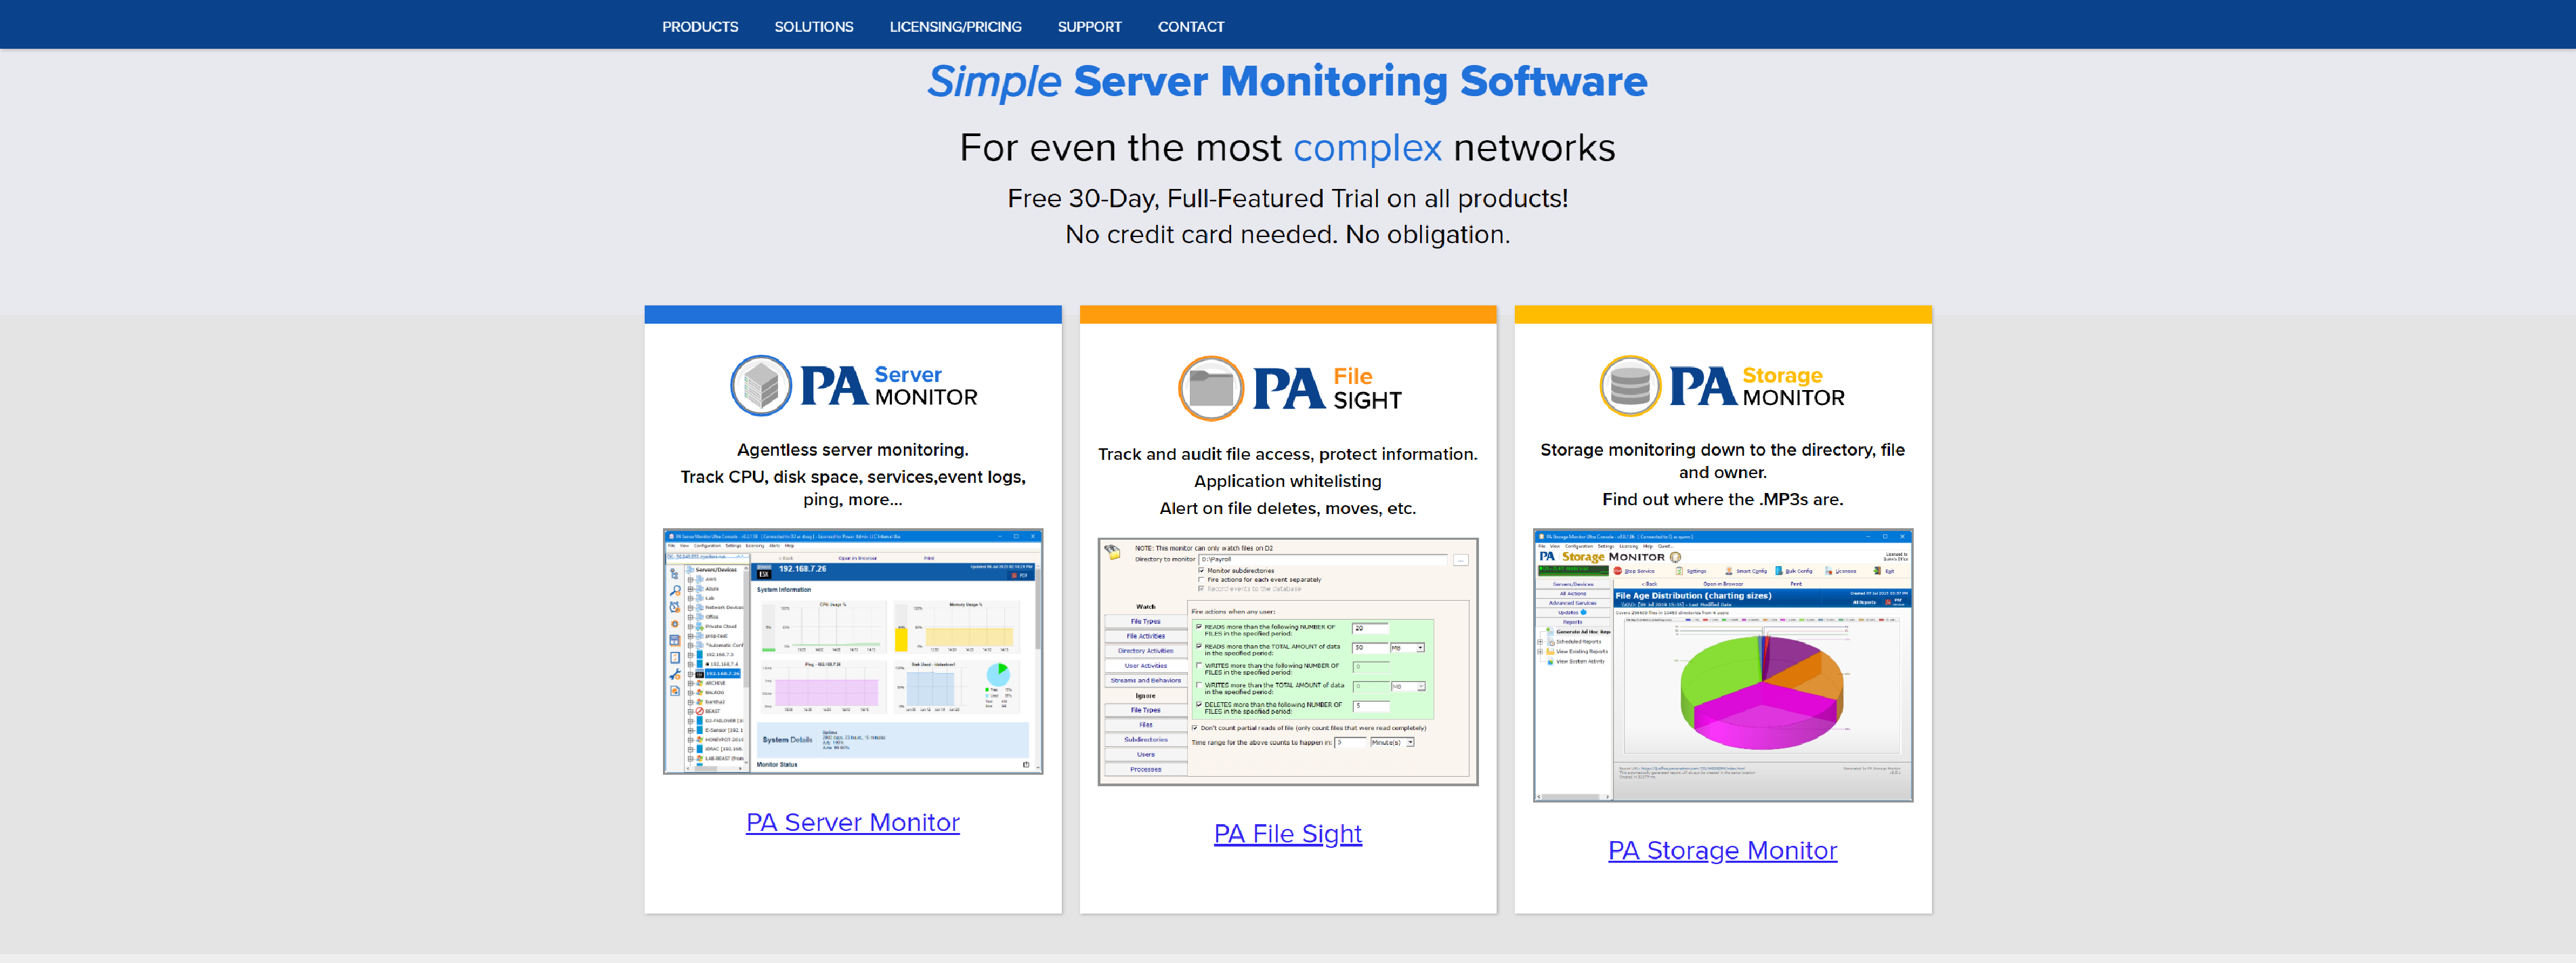
PA Server Monitor offers excellent support for monitoring Unix-based systems, such as Linux, as well as network devices like routers and firewalls.
- Monitors key Linux system metrics including CPU usage, memory, disk space, and network activity to ensure optimal server performance
- Configurable alerts notify you of potential issues based on specific thresholds, helping to prevent downtime and ensure smooth server operations
- Monitors running processes on Linux servers, providing detailed information about resource usage and identifying any processes consuming excessive resources
- In addition to server monitoring, it supports the monitoring of network devices such as routers and firewalls, offering a complete view of your infrastructure
- Enables remote monitoring of Linux servers, ensuring you can track performance and receive alerts even when managing systems in different locations
- Provides detailed reports on resource utilization, helping you identify trends, optimize system performance, and plan for capacity needs
- Allows you to access historical performance data, enabling trend analysis and proactive troubleshooting of performance issues
- Offers customizable dashboards that allow you to visualize server health and performance metrics in a way that suits your needs
- Scales with your infrastructure, making it suitable for both small Linux deployments and larger, more complex server environments
- Quick and straightforward installation process, with easy configuration options that ensure monitoring can be set up in minutes
- PA Server Monitor provides monitoring across various platforms, supporting not just Linux, but also Windows and other Unix-based systems
- Configurable notifications via email or SMS ensure that system administrators are alerted to issues in real-time, wherever they are
Nectus5
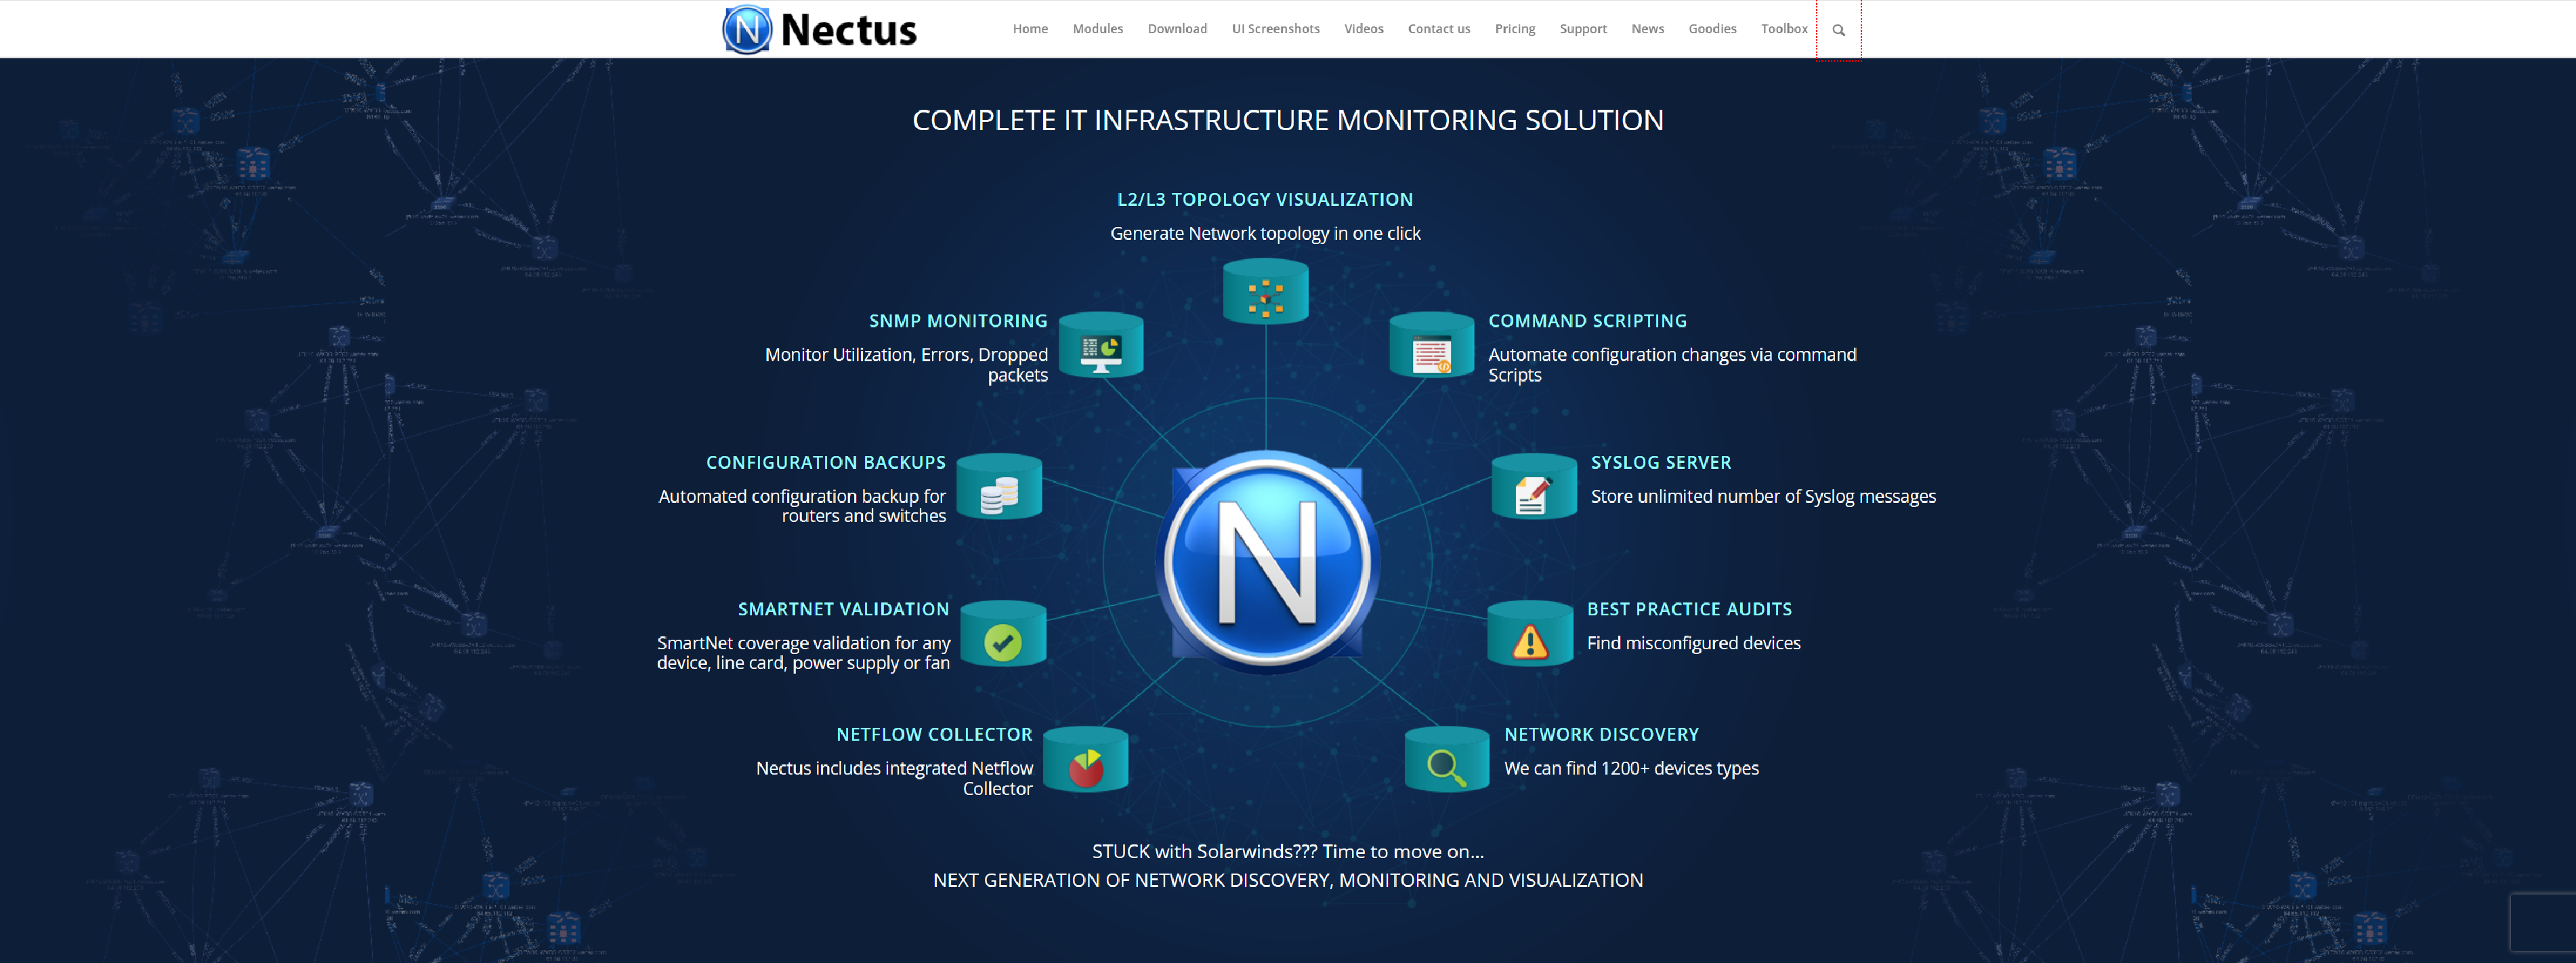
Nectus5 provides tools designed to monitor the performance of Linux servers, track important system metrics, and ensure the servers run efficiently.
- Nectus5 provides detailed monitoring for Linux servers, including key metrics like CPU usage, memory, disk space, and network performance
- Track the real-time performance of your Linux servers to ensure they are running optimally, preventing potential downtime
- Set custom alerts based on thresholds for various server metrics. Receive notifications when performance deviates from desired levels to take proactive action
- Access historical performance data to analyze trends, detect recurring issues, and optimize server resource allocation
- Monitor all your Linux servers from a centralized dashboard, providing a unified view of your entire infrastructure’s health and performance
- Detect and address issues before they impact service availability by monitoring system health and performance indicators in real-time
- Monitor security-related aspects such as failed login attempts and unauthorized access to help ensure the safety of your server environment
- Automatically generate reports on your server performance, providing clear insights into system health and helping with compliance and audits
- Scalable to accommodate both small and large environments, ensuring seamless monitoring as your infrastructure grows
- Supports monitoring of multiple Linux servers, making it suitable for managing both small setups and large-scale infrastructures
Servicepilot
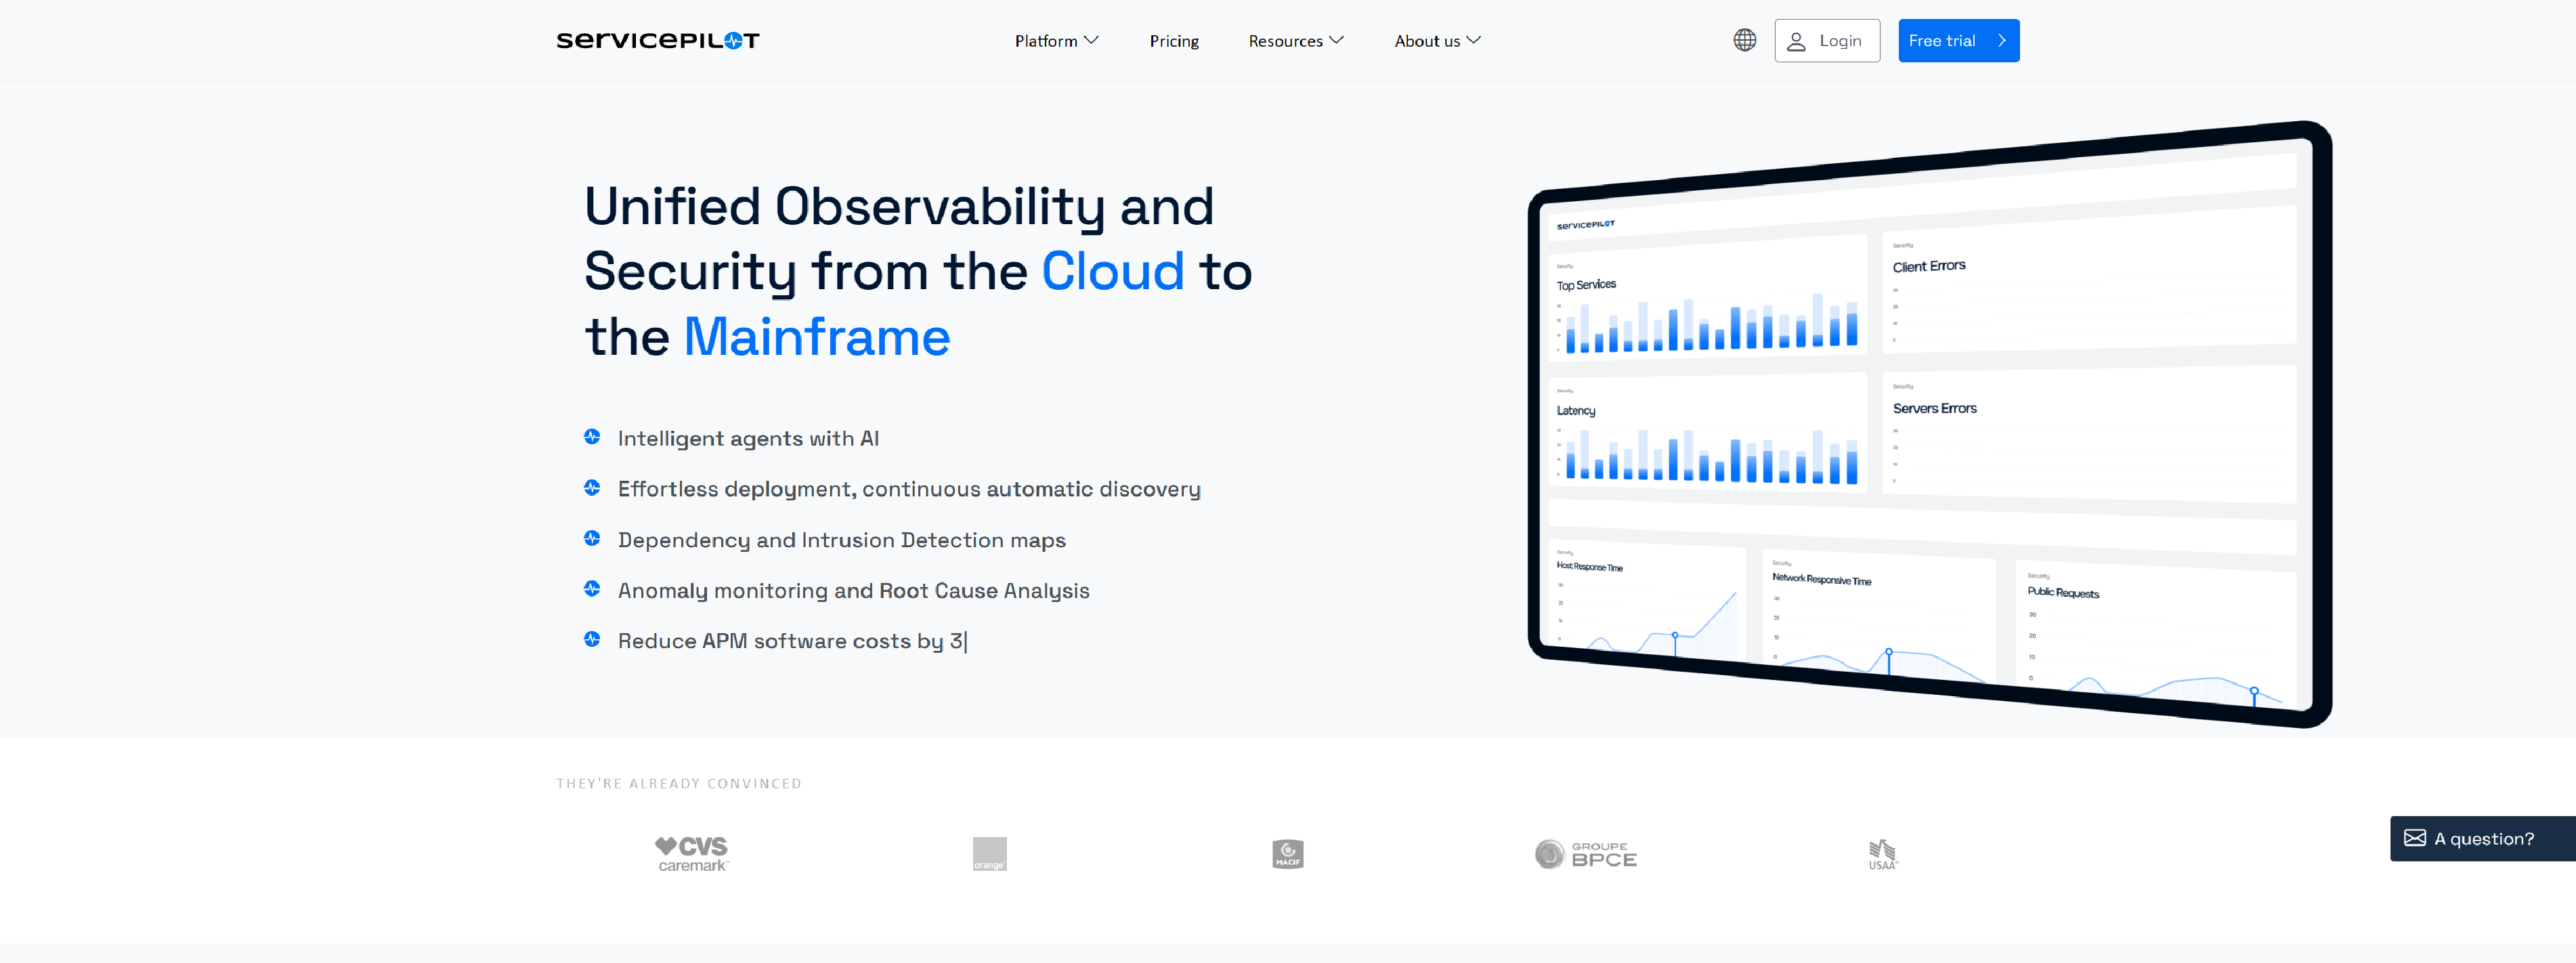
Servicepilot enables IT infrastructure performance monitoring, automatic application discovery, centralized alert management, and more.
- Automated discovery, mapping, and real-time monitoring
- Monitoring and historical analysis of Linux server performance
- Automated, detailed insights into key performance indicators
- Correlation of application performance, syslogs, and server metrics
Motadata
Monitor your Linux server with Motadata AIOps to boost network performance, improve operational management, and gain deeper insights into critical performance metrics for enhanced health and high availability.
- SNMP & SSH-based monitoring with Motadata AIOps
- Linux log monitoring
- Key performance metrics for Linux server networks
- In-depth reports and customizable dashboards
- Health and availability monitoring with Motadata AIOps
Xitoring
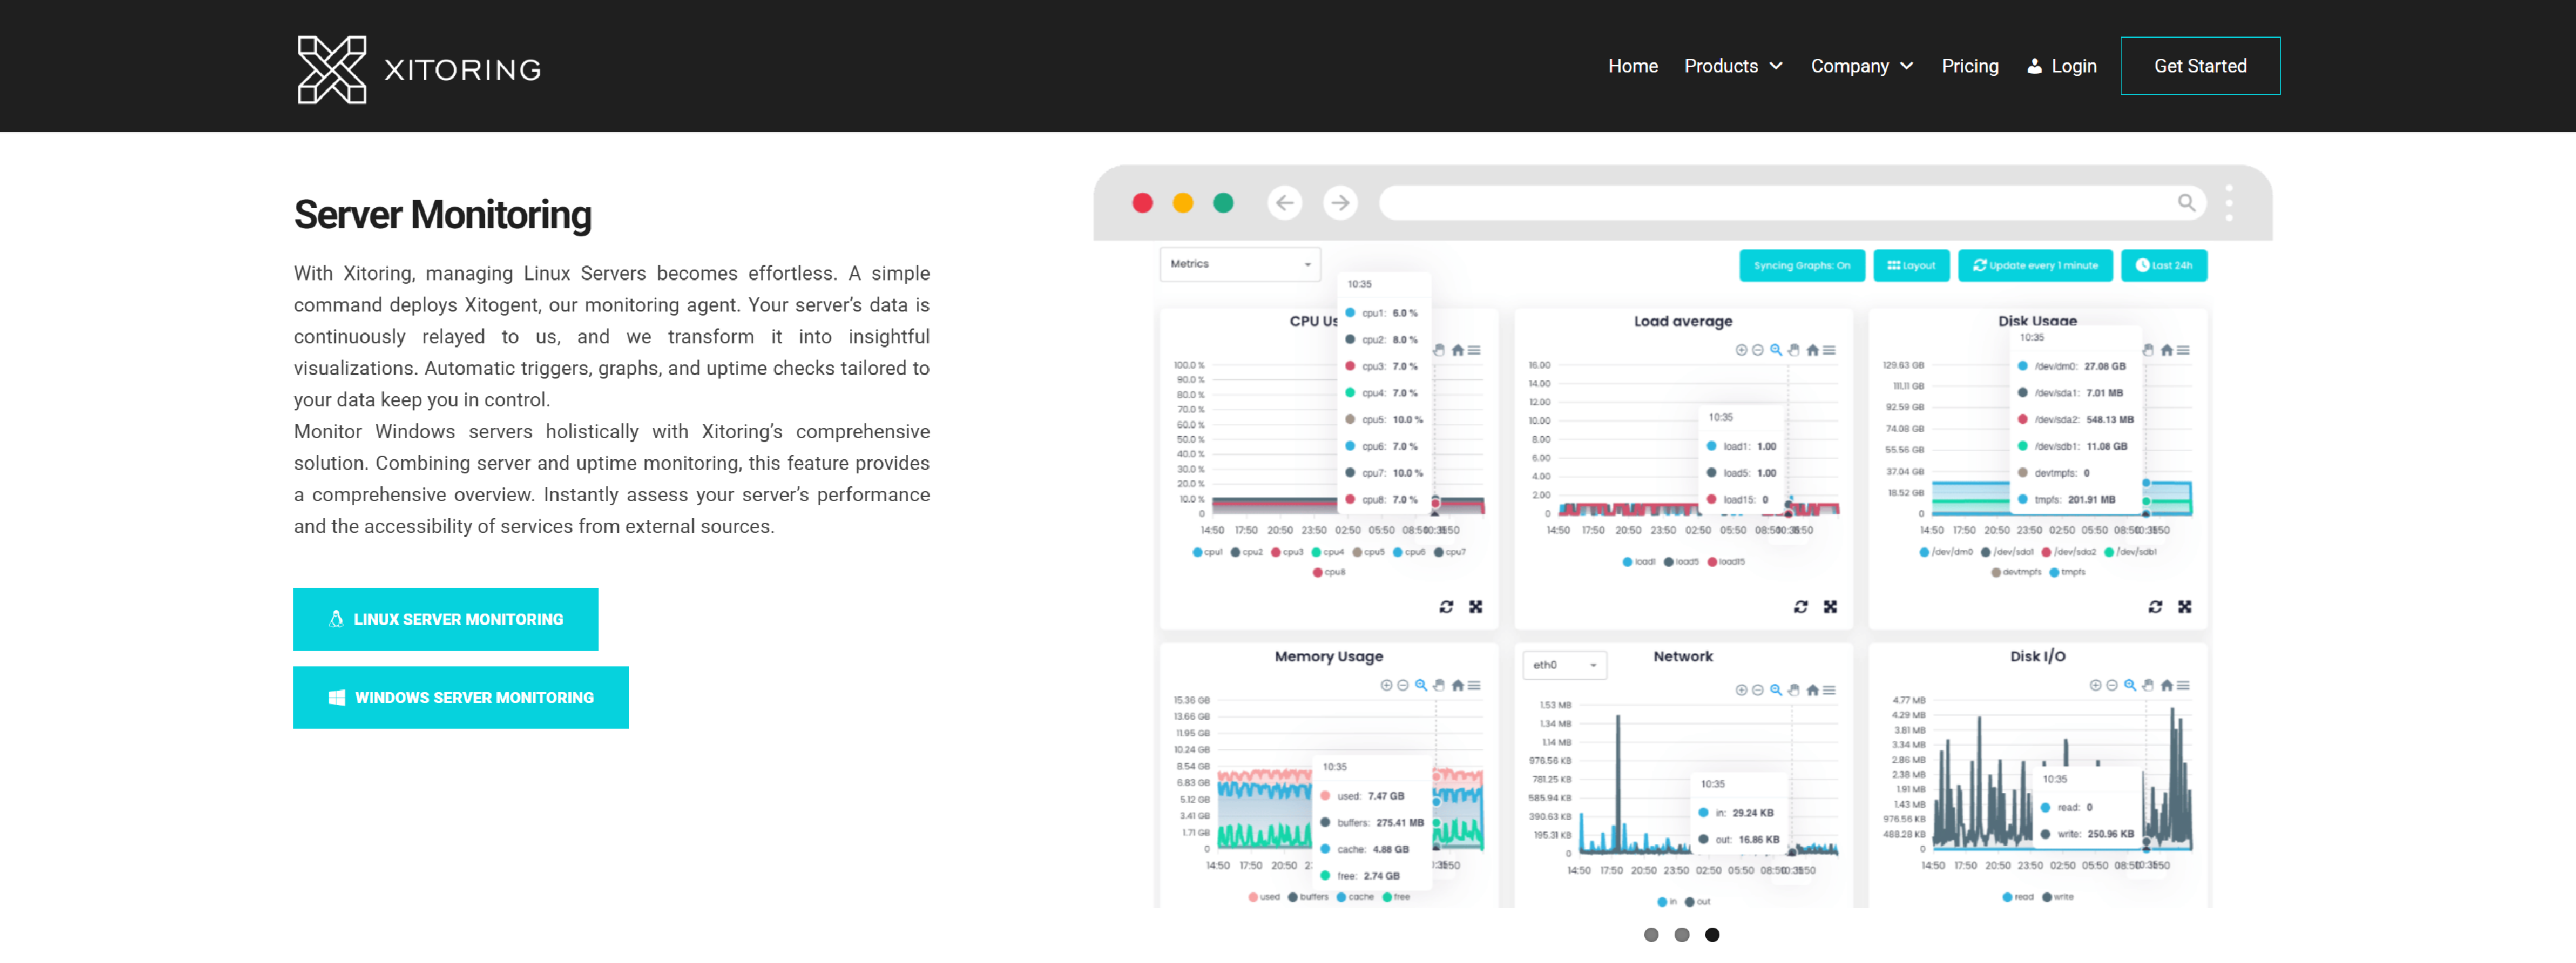
Xitoring provides uptime monitoring, server monitoring for both Linux and Windows, along with a public status page.
- Fast agent installation
- Install on hundreds of servers simultaneously
- Extensive integration options
- Auto-update functionality
- Mobile app support
- Built-in heartbeat monitoring
- Actively developed with monthly stable releases
- Customizable triggers and alerts
Top 7 free Linux monitoring tool
htop – An interactive, real-time process monitoring tool that is an enhanced version of the traditional top command.
Netata – A real-time monitoring tool that provides detailed insights into your server’s performance via a web interface.
Zabbix – A powerful open-source monitoring solution for servers, networks, and applications.
Prometheus (with Grafana) – A monitoring and alerting toolkit that collects and stores time-series data.
Nagios Core – A widely used open-source tool for monitoring IT infrastructure, including servers, network devices, and services.
Glances – A cross-platform system monitoring tool that provides a high-level overview of various system metrics.
Munin – A networked resource monitoring tool that provides detailed graphs for performance metrics.
What is Linux Server Monitoring Tools
Linux server monitoring tools are software applications used to track the performance, health, and status of Linux servers. These tools monitor various components like CPU, memory, disk, network, processes, and services to ensure optimal server performance, prevent downtime, and detect issues.
Performance Metrics Collection
- CPU Usage: Percentage of CPU time used by processes, idle time, and load averages.
- Memory Usage: Amount of RAM used, free memory, and swap usage.
- Disk Usage: Disk space used, available space, and I/O performance (read/write operations).
- Network Traffic: Incoming and outgoing data, packet loss, and latency.
- Processes: Number of running processes, resource usage by each process, and process states.
- Disk I/O: Read/write operations, disk latency, and throughput.
- Uptime and Load: System uptime and load average over different periods.
- Temperature and Hardware Health: CPU and system temperatures, disk health (SMART data).
Why Monitor Your Linux Server?
Monitoring your Linux server is crucial for maintaining the health, security, and performance of your system.
Prevent Downtime: Servers can experience hardware failures, software crashes, or configuration errors. Monitoring allows you to detect these issues early before they cause system outages. Proactive monitoring helps ensure minimal downtime, which is critical for businesses that rely on uninterrupted access to services.
Optimize Performance: By tracking key system metrics like CPU usage, memory, disk space, and network activity, you can identify bottlenecks or inefficiencies.
Track Resource Usage: Over time, your server’s resource usage may increase due to new processes, users, or applications. Monitoring helps you keep an eye on resource consumption (e.g., CPU, RAM, disk space) so that you can scale or upgrade resources as needed, avoiding slowdowns or crashes due to resource exhaustion.
Security Monitoring: Monitoring tools can help you track unusual behavior, such as unexpected login attempts, spikes in network traffic, or changes to critical system files. These can be indicators of a potential security breach or an ongoing attack. Early detection of security threats can help prevent serious damage.
Automate Alerts and Notifications: With monitoring tools, you can set thresholds for system metrics. If a metric exceeds a certain threshold (e.g., CPU usage over 90%), the system can alert you.
Troubleshoot Issues: In case of server issues, monitoring provides valuable historical data that can help diagnose problems. You can look at logs, performance trends, and resource usage patterns leading up to the issue, which makes it easier to pinpoint the root cause.
Capacity Planning: By continuously monitoring your server’s performance, you can track growth trends over time.
Improve Reliability: Regularly monitoring the server’s health and performance can catch small issues before they become large problems, leading to better overall system reliability and availability.
Manage and Scale Infrastructure Efficiently: For organizations with large infrastructures or multiple servers, monitoring tools help keep track of different systems in real-time, enabling efficient management. You can prioritize issues, automate actions, and scale systems based on demand.
Optimize Software and Application Performance: Monitoring your server can also give insights into how applications and services running on the server are performing. If a particular application is consuming too many resources or encountering errors, it can be isolated and addressed.
Reduce Operational Costs: By catching problems early and optimizing resource usage, monitoring can help prevent costly downtime and performance issues, ultimately leading to a more cost-effective operation.
Top 13 General FAQ for Linux Server Monitoring Tools
What exactly is server monitoring?
Server monitoring refers to the practice of continuously tracking the health and performance of a server. This includes monitoring critical system metrics like CPU usage, memory consumption, disk space, network traffic, and running processes to ensure the server runs optimally and to detect any potential issues before they become serious problems.
How does server monitoring help with performance optimization?
By tracking key system metrics, monitoring tools allow you to spot performance bottlenecks, such as high CPU usage, memory exhaustion, or disk I/O problems.
What kind of alerts can I set up in monitoring tools?
Monitoring tools allow you to set thresholds for various metrics (e.g., CPU usage, memory usage, disk space). When these thresholds are exceeded, the tool can send alerts via email, SMS, or integrate with services like Slack. You can configure alerts for different levels of severity, like warnings or critical failures.
Are these monitoring tools resource-intensive?
It depends on the tool and its configuration. Some tools, like htop, are lightweight and run in the terminal with minimal impact on system resources. More comprehensive tools, like Zabbix or Prometheus, may require more resources, especially when monitoring large infrastructures.
Can I monitor services (e.g., web servers, databases) with Linux server monitoring tools?
Yes, many monitoring tools (like Nagios and Zabbix) can be configured to monitor specific services, such as web servers (Apache, Nginx), databases (MySQL, PostgreSQL), and other applications.
How do I monitor my Linux server remotely?
Most monitoring tools allow remote monitoring through a web interface or via secure agents installed on the server.
Can I monitor a Linux server without installing any agents?
Yes, some tools allow agentless monitoring. For example, Nagios and Zabbix can monitor servers via SSH or SNMP (Simple Network Management Protocol) without needing an agent installed on the server.
What kind of visualizations do monitoring tools provide?
Most modern monitoring tools, like Grafana (when paired with Prometheus) or Netdata, offer customizable dashboards that visualize server performance metrics with graphs, charts, and tables. This makes it easier to analyze trends, track historical data, and quickly identify problems.
How do I analyze and use monitoring data effectively?
Monitoring tools not only provide real-time data but also store historical data. By analyzing this data over time, you can spot trends (e.g., increasing CPU usage or memory consumption) and plan for capacity needs, identify recurring issues, and make informed decisions about system scaling or optimizations.
How do I set up monitoring for a large infrastructure?
For large infrastructures, distributed monitoring tools like Zabbix, Nagios, or Prometheus are ideal. These tools support a hierarchical structure where different components (like agents on various servers) send data to a central monitoring server.
What happens if the monitoring tool itself fails?
If the monitoring tool experiences downtime, it can prevent alerts from being triggered or performance data from being recorded. To mitigate this risk, ensure the monitoring system is highly available, using redundant servers or services (e.g., running multiple instances of the monitoring tool or storing data in a reliable database).
Are these tools secure?
Security is an important aspect of monitoring, as some tools require access to sensitive system data. Most tools, like Zabbix or Nagios, have secure authentication mechanisms (e.g., SSH keys, HTTPS) to ensure that only authorized users can access the monitoring data. Make sure to follow best practices for securing monitoring systems and limit access to sensitive data.
Can I integrate my monitoring tool with other IT systems?
Yes, many monitoring tools offer integration capabilities with other systems, such as incident management platforms (e.g., PagerDuty, Slack, JIRA), or cloud platforms (e.g., AWS, Google Cloud). This helps automate workflows and streamline incident response.
Final words
Linux server monitoring tools are essential for maintaining the health, performance, and security of your infrastructure. By continuously tracking key metrics, such as CPU usage, memory consumption, disk I/O, and network traffic, these tools help you identify and resolve issues before they cause significant problems, ensuring minimal downtime and optimal performance.
Whether you’re managing a small server or a large-scale infrastructure, there is a wide range of tools available to suit your needs. For lighter, real-time monitoring, htop or Netdata work well. For more robust and scalable solutions, Zabbix, Prometheus (with Grafana), and Nagios offer powerful features for enterprise-level monitoring and alerting.
Remember to choose the tool that aligns with your goals, whether it’s detailed visualizations, scalability, ease of setup, or comprehensive service monitoring. Regularly monitoring your Linux server not only ensures smooth operation but also helps you stay ahead of potential issues, improving both security and performance over time.